

Homework Answers


Add Answer to:
Part 1: Exponential Fourier series The following MATLAB code calculates the exponential Fourier series coefficient for...
Reproduce Figures 9.2b and 9.2c on MATLAB, assuming that the square wave (Figure 9.2b) is a...
 Reproduce Figures 9.2b and 9.2c on MATLAB, assuming that the
square wave (Figure 9.2b) is a periodic symmetric square wave of
normalized amplitude (A=1). Each student group should
decide the power spectral density level of the channel noise.
Compute the Fourier transform of the periodic square wave.
clear all
close all
%%%%
T=12*pi; %number of period
x=linspace(0,T);
t=x/pi
y0=square(x); %square wave signal
y0ft=fft(y0); %calculating Fourier Transformof signal
y0fts=fftshift(y0ft);
y0ftFinal=abs(y0ft);
AWGN= rand(size(x)); %Calculating whit noise
Att=(1/3);
nSig= Att*AWGN;
y=y0+nSig; %Square wave...
Reproduce Figures 9.2b and 9.2c on MATLAB, assuming that the
square wave (Figure 9.2b) is a periodic symmetric square wave of
normalized amplitude (A=1). Each student group should
decide the power spectral density level of the channel noise.
Compute the Fourier transform of the periodic square wave.
clear all
close all
%%%%
T=12*pi; %number of period
x=linspace(0,T);
t=x/pi
y0=square(x); %square wave signal
y0ft=fft(y0); %calculating Fourier Transformof signal
y0fts=fftshift(y0ft);
y0ftFinal=abs(y0ft);
AWGN= rand(size(x)); %Calculating whit noise
Att=(1/3);
nSig= Att*AWGN;
y=y0+nSig; %Square wave...
f) Calculate the coefficients of the trigonometric form of the Fourier series numerically in MATLAB and...
 f) Calculate the coefficients of the trigonometric form of the Fourier series
numerically in MATLAB and graphically represent the one-sided spectrum
(width and phase) frequency for n up to 10 compared to the analytics results.
g) From the coefficients of the trigonometric form of the Fourier series ,
calculate the coefficients of the exposure series and present the two-sided spectrum (width and phase) frequency.
h) Find the average and active value of the signal from the Fourier expansion.
i) Check...
f) Calculate the coefficients of the trigonometric form of the Fourier series
numerically in MATLAB and graphically represent the one-sided spectrum
(width and phase) frequency for n up to 10 compared to the analytics results.
g) From the coefficients of the trigonometric form of the Fourier series ,
calculate the coefficients of the exposure series and present the two-sided spectrum (width and phase) frequency.
h) Find the average and active value of the signal from the Fourier expansion.
i) Check...
Q1) For the periodic signals x() and ) shown below: x(t) YCO y(t) a) Find the exponential Fourier...
 Q1) For the periodic signals x() and ) shown below: x(t) YCO y(t) a) Find the exponential Fourier series for x(t) and y). b) Sketch the amplitude and phase spectra for signal x(). c) Use Parseval's theorem to approximate the power of the periodic signal x() by calculating the power of the first N harmonics, such that the strength of the Nth harmonic is 10% or more of the power of the DC component.
Q1) For the periodic signals x()...
Q1) For the periodic signals x() and ) shown below: x(t) YCO y(t) a) Find the exponential Fourier series for x(t) and y). b) Sketch the amplitude and phase spectra for signal x(). c) Use Parseval's theorem to approximate the power of the periodic signal x() by calculating the power of the first N harmonics, such that the strength of the Nth harmonic is 10% or more of the power of the DC component.
Q1) For the periodic signals x()...
PLZ shows you Matlab Code X(t) 2 2 46 1. compute the Fourier Series coefficients, ck...
 PLZ shows you Matlab Code
X(t) 2 2 46 1. compute the Fourier Series coefficients, ck for the signal x(t) 2. plot magnitude of c and the phase of ck in separate plots (use subplot command) plot the Fourier Series coefficients for the square wave signal: ck(12/9) sinc(2"k/3)
PLZ shows you Matlab Code
X(t) 2 2 46 1. compute the Fourier Series coefficients, ck for the signal x(t) 2. plot magnitude of c and the phase of ck in separate plots (use subplot command) plot the Fourier Series coefficients for the square wave signal: ck(12/9) sinc(2"k/3)
signal and systems 3.11. For each of the following signals, compute the complex exponential Fourier series...
 signal and systems
3.11. For each of the following signals, compute the complex exponential Fourier series by using trigonometric identities, and then sketch the amplitude and phase spectra for all values of k , (a) x(t) = cos(51-7r/4) (b) x(1) sin! + cos[
signal and systems
3.11. For each of the following signals, compute the complex exponential Fourier series by using trigonometric identities, and then sketch the amplitude and phase spectra for all values of k , (a) x(t) = cos(51-7r/4) (b) x(1) sin! + cos[
Please send the Matlab code 2. Compute the Fourier series coefficients for x(t) using MATLAB and...
 Please send the Matlab code
2. Compute the Fourier series coefficients for x(t) using MATLAB and plot the double-sided spectra up to the 10th harmonic. (20 points) 수 x(t) -10 10 20 30
Please send the Matlab code
2. Compute the Fourier series coefficients for x(t) using MATLAB and plot the double-sided spectra up to the 10th harmonic. (20 points) 수 x(t) -10 10 20 30
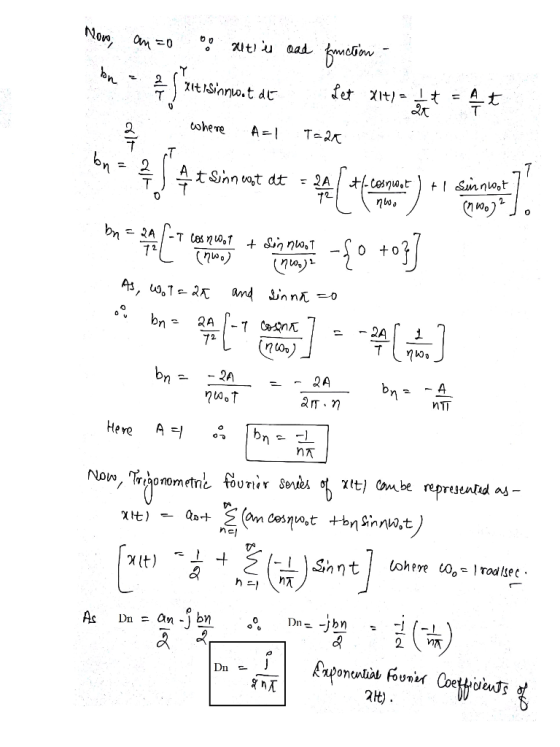
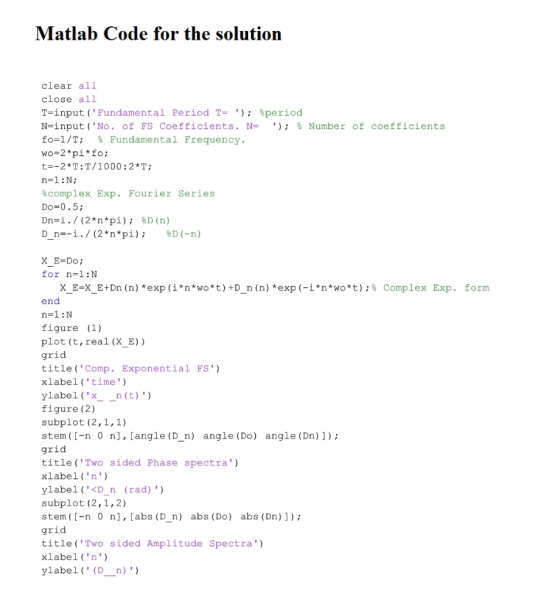
Problem 2: For the signal g(t) t, a) (25 points) Find the exponential Fourier series to...
 Problem 2: For the signal g(t) t, a) (25 points) Find the exponential Fourier series to represent g(t) over the interval (-π, π). Sketch the spectra (amplitude and phase of Fourier series coefficients). b) (25 points) Find the average power of g(t) within interval (- ,r). Using this result and given that Σ00.-6, verify the Parseval's theorem
I wrote a Matlab program for the figure below. When I plot the waves, they look...
I wrote a Matlab program for the figure below. When I plot the waves, they look the same. Why do the two waves frequencies look same and How do I avoid it? (I really do need this part of the question answered.) N = 200; % Total number of time domain samples in simulation. Fs = 100 ;% sampling frequency. F1 = 10; % frequency of wave - 1. F2 = 90; % frequency of wave - 2. phi =...
Problem 6: I7 Points For the following periodic signal, x(t) 4OSesi a) Express the signal exponent +cos(9t) +2cos(15t) al in complex exponential Fourier series form. 13 r series coefficients and...
 Problem 6: I7 Points For the following periodic signal, x(t) 4OSesi a) Express the signal exponent +cos(9t) +2cos(15t) al in complex exponential Fourier series form. 13 r series coefficients and sketch the spectral line. [2 Find the fundamental frequency and identilY the harmonics in the signal. 12) Solution
Problem 6: I7 Points For the following periodic signal, x(t) 4OSesi a) Express the signal exponent +cos(9t) +2cos(15t) al in complex exponential Fourier series form. 13 r series coefficients and sketch the...
Problem 6: I7 Points For the following periodic signal, x(t) 4OSesi a) Express the signal exponent +cos(9t) +2cos(15t) al in complex exponential Fourier series form. 13 r series coefficients and sketch the spectral line. [2 Find the fundamental frequency and identilY the harmonics in the signal. 12) Solution
Problem 6: I7 Points For the following periodic signal, x(t) 4OSesi a) Express the signal exponent +cos(9t) +2cos(15t) al in complex exponential Fourier series form. 13 r series coefficients and sketch the...
3.11-For each of the following signals compute the complex exponential Fourier series by using tr...
 3.11-For each of the following signals compute the complex exponential Fourier series by using trigonometric identities,and then sketch the amplitude and phase spectra for all values of k (a) x(t)-cos(5t-π/4) (b) x(t) sint+ cos t 756 Chapter & The Series and fourier Translorm 023 4 5 ibi FIGURE Pa P33 3.13 Problems 157 in 0 14 12 3 I) ain FIGURE ,3.3 (antísndj (c) sti)-cos(1-1) + sin(,-%) 3.12. Determine the exponential Fourier series tor the Following periodic signals
3.11-For each...
3.11-For each of the following signals compute the complex exponential Fourier series by using trigonometric identities,and then sketch the amplitude and phase spectra for all values of k (a) x(t)-cos(5t-π/4) (b) x(t) sint+ cos t 756 Chapter & The Series and fourier Translorm 023 4 5 ibi FIGURE Pa P33 3.13 Problems 157 in 0 14 12 3 I) ain FIGURE ,3.3 (antísndj (c) sti)-cos(1-1) + sin(,-%) 3.12. Determine the exponential Fourier series tor the Following periodic signals
3.11-For each...
 Reproduce Figures 9.2b and 9.2c on MATLAB, assuming that the
square wave (Figure 9.2b) is a periodic symmetric square wave of
normalized amplitude (A=1). Each student group should
decide the power spectral density level of the channel noise.
Compute the Fourier transform of the periodic square wave.
clear all
close all
%%%%
T=12*pi; %number of period
x=linspace(0,T);
t=x/pi
y0=square(x); %square wave signal
y0ft=fft(y0); %calculating Fourier Transformof signal
y0fts=fftshift(y0ft);
y0ftFinal=abs(y0ft);
AWGN= rand(size(x)); %Calculating whit noise
Att=(1/3);
nSig= Att*AWGN;
y=y0+nSig; %Square wave...
Reproduce Figures 9.2b and 9.2c on MATLAB, assuming that the
square wave (Figure 9.2b) is a periodic symmetric square wave of
normalized amplitude (A=1). Each student group should
decide the power spectral density level of the channel noise.
Compute the Fourier transform of the periodic square wave.
clear all
close all
%%%%
T=12*pi; %number of period
x=linspace(0,T);
t=x/pi
y0=square(x); %square wave signal
y0ft=fft(y0); %calculating Fourier Transformof signal
y0fts=fftshift(y0ft);
y0ftFinal=abs(y0ft);
AWGN= rand(size(x)); %Calculating whit noise
Att=(1/3);
nSig= Att*AWGN;
y=y0+nSig; %Square wave...
 f) Calculate the coefficients of the trigonometric form of the Fourier series
numerically in MATLAB and graphically represent the one-sided spectrum
(width and phase) frequency for n up to 10 compared to the analytics results.
g) From the coefficients of the trigonometric form of the Fourier series ,
calculate the coefficients of the exposure series and present the two-sided spectrum (width and phase) frequency.
h) Find the average and active value of the signal from the Fourier expansion.
i) Check...
f) Calculate the coefficients of the trigonometric form of the Fourier series
numerically in MATLAB and graphically represent the one-sided spectrum
(width and phase) frequency for n up to 10 compared to the analytics results.
g) From the coefficients of the trigonometric form of the Fourier series ,
calculate the coefficients of the exposure series and present the two-sided spectrum (width and phase) frequency.
h) Find the average and active value of the signal from the Fourier expansion.
i) Check...
 Q1) For the periodic signals x() and ) shown below: x(t) YCO y(t) a) Find the exponential Fourier series for x(t) and y). b) Sketch the amplitude and phase spectra for signal x(). c) Use Parseval's theorem to approximate the power of the periodic signal x() by calculating the power of the first N harmonics, such that the strength of the Nth harmonic is 10% or more of the power of the DC component.
Q1) For the periodic signals x()...
Q1) For the periodic signals x() and ) shown below: x(t) YCO y(t) a) Find the exponential Fourier series for x(t) and y). b) Sketch the amplitude and phase spectra for signal x(). c) Use Parseval's theorem to approximate the power of the periodic signal x() by calculating the power of the first N harmonics, such that the strength of the Nth harmonic is 10% or more of the power of the DC component.
Q1) For the periodic signals x()...
 PLZ shows you Matlab Code
X(t) 2 2 46 1. compute the Fourier Series coefficients, ck for the signal x(t) 2. plot magnitude of c and the phase of ck in separate plots (use subplot command) plot the Fourier Series coefficients for the square wave signal: ck(12/9) sinc(2"k/3)
PLZ shows you Matlab Code
X(t) 2 2 46 1. compute the Fourier Series coefficients, ck for the signal x(t) 2. plot magnitude of c and the phase of ck in separate plots (use subplot command) plot the Fourier Series coefficients for the square wave signal: ck(12/9) sinc(2"k/3)
 signal and systems
3.11. For each of the following signals, compute the complex exponential Fourier series by using trigonometric identities, and then sketch the amplitude and phase spectra for all values of k , (a) x(t) = cos(51-7r/4) (b) x(1) sin! + cos[
signal and systems
3.11. For each of the following signals, compute the complex exponential Fourier series by using trigonometric identities, and then sketch the amplitude and phase spectra for all values of k , (a) x(t) = cos(51-7r/4) (b) x(1) sin! + cos[
 Please send the Matlab code
2. Compute the Fourier series coefficients for x(t) using MATLAB and plot the double-sided spectra up to the 10th harmonic. (20 points) 수 x(t) -10 10 20 30
Please send the Matlab code
2. Compute the Fourier series coefficients for x(t) using MATLAB and plot the double-sided spectra up to the 10th harmonic. (20 points) 수 x(t) -10 10 20 30
 Problem 2: For the signal g(t) t, a) (25 points) Find the exponential Fourier series to represent g(t) over the interval (-π, π). Sketch the spectra (amplitude and phase of Fourier series coefficients). b) (25 points) Find the average power of g(t) within interval (- ,r). Using this result and given that Σ00.-6, verify the Parseval's theorem
 Problem 6: I7 Points For the following periodic signal, x(t) 4OSesi a) Express the signal exponent +cos(9t) +2cos(15t) al in complex exponential Fourier series form. 13 r series coefficients and sketch the spectral line. [2 Find the fundamental frequency and identilY the harmonics in the signal. 12) Solution
Problem 6: I7 Points For the following periodic signal, x(t) 4OSesi a) Express the signal exponent +cos(9t) +2cos(15t) al in complex exponential Fourier series form. 13 r series coefficients and sketch the...
Problem 6: I7 Points For the following periodic signal, x(t) 4OSesi a) Express the signal exponent +cos(9t) +2cos(15t) al in complex exponential Fourier series form. 13 r series coefficients and sketch the spectral line. [2 Find the fundamental frequency and identilY the harmonics in the signal. 12) Solution
Problem 6: I7 Points For the following periodic signal, x(t) 4OSesi a) Express the signal exponent +cos(9t) +2cos(15t) al in complex exponential Fourier series form. 13 r series coefficients and sketch the...
 3.11-For each of the following signals compute the complex exponential Fourier series by using trigonometric identities,and then sketch the amplitude and phase spectra for all values of k (a) x(t)-cos(5t-π/4) (b) x(t) sint+ cos t 756 Chapter & The Series and fourier Translorm 023 4 5 ibi FIGURE Pa P33 3.13 Problems 157 in 0 14 12 3 I) ain FIGURE ,3.3 (antísndj (c) sti)-cos(1-1) + sin(,-%) 3.12. Determine the exponential Fourier series tor the Following periodic signals
3.11-For each...
3.11-For each of the following signals compute the complex exponential Fourier series by using trigonometric identities,and then sketch the amplitude and phase spectra for all values of k (a) x(t)-cos(5t-π/4) (b) x(t) sint+ cos t 756 Chapter & The Series and fourier Translorm 023 4 5 ibi FIGURE Pa P33 3.13 Problems 157 in 0 14 12 3 I) ain FIGURE ,3.3 (antísndj (c) sti)-cos(1-1) + sin(,-%) 3.12. Determine the exponential Fourier series tor the Following periodic signals
3.11-For each...
Most questions answered within 3 hours.
-
Using MARS simulator, write MIPS programs according to
the following scenarios: Receive a positive integer number...
asked 45 minutes ago -
An object in front of a concave mirror has a real image that is
11.5 cm...
asked 58 minutes ago -
Consider the reaction, C3 H8 + O2 --> CO2 + H2O. How many
moles of O2...
asked 2 hours ago -
You and your opponent both roll a fair die. If you both roll the
same number,...
asked 3 hours ago -
In a study of the accuracy of fast food drive-through orders,
Restaurant A had 257 accurate...
asked 3 hours ago -
Identify and describe in detail the four categories of
institutions that could be included in a...
asked 3 hours ago -
In python
class Customer:
def __init__(self, customer_id, last_name, first_name, phone_number, address):
self._customer_id = int(customer_id)
self._last_name =...
asked 3 hours ago -
What is an example of a limitation in implementing a new
ERP system and how it...
asked 3 hours ago -
In a section of 9.7cm of an artery with a radius of 2.6mm there
is a...
asked 3 hours ago -
the two carboxylic acid groups of aspartic acid have different
acidities with pKa values of 2.1...
asked 3 hours ago -
Would CuCO3 aqueous salt combined with calcium chloride
form a solid precipitate? If so, what would...
asked 3 hours ago -
How do ECM Solutions assist in embedding a culture of continuous
improvement in an organization? (Project...
asked 3 hours ago