Mastery Problem: Financial Statement Analysis Liquidity and Solvency Measures Your friend, another accountant, has bet you...
Mastery Problem: Financial Statement Analysis
Liquidity and Solvency Measures
Your friend, another accountant, has bet you that with your knowledge of accounting and just the computations for common analytical measures, you can figure out many aspects of a company's financial statements. You take the bet!
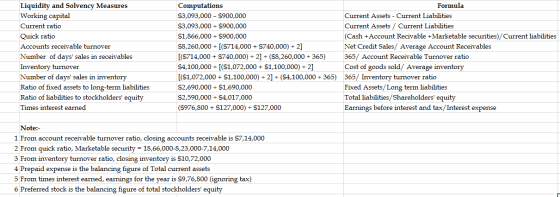
Match each computation to one of the liquidity and solvency measures in the table. (Hint: Begin by looking for simple computations and identifying the amounts in those computations. Look for other measures that use those amounts.)
| Liquidity and Solvency Measures | Computations | |
| Working capital | $3,093,000 – $900,000 | |
| Current ratio | $3,093,000 ÷ $900,000 | |
| Quick ratio | $1,866,000 ÷ $900,000 | |
| Accounts receivable turnover | $8,260,000 ÷ [($714,000 + $740,000) ÷ 2] | |
| Number of days' sales in receivables | [($714,000 + $740,000) ÷ 2] ÷ ($8,260,000 ÷ 365) | |
| Inventory turnover | $4,100,000 ÷ [($1,072,000 + $1,100,000) ÷ 2] | |
| Number of days' sales in inventory | [($1,072,000 + $1,100,000) ÷ 2] ÷ ($4,100,000 ÷ 365) | |
| Ratio of fixed assets to long-term liabilities | $2,690,000 ÷ $1,690,000 | |
| Ratio of liabilities to stockholders' equity | $2,590,000 ÷ $4,017,000 | |
| Times interest earned | ($976,800 + $127,000) ÷ $127,000 |
Feedback
Balance Sheet
Use the following balance sheet form to enter amounts you identify from the computations on the Liquidity and Solvency Measures part. You will identify other amounts for the balance sheet on the Profitability Measures part. If you have a choice of two amounts, assume the first amount in the ratio is for the end of the year. Compute any missing amounts.
| Balance Sheet December 31, 20Y6 |
|
| Assets | |
| Current assets: | |
| Cash | $823,000 |
| Marketable securities | |
| Accounts receivable (net) | |
| Inventory | |
| Prepaid expenses | |
| Total current assets | $3,093,000 |
| Long-term investments | 824000 |
| Property, plant, and equipment (net) | 2,690,000 |
| Total assets | $6,607,000 |
| Liabilities | |
| Current liabilities | $900,000 |
| Long-term liabilities | 1,690,000 |
| Total liabilities | $2,590,000 |
| Stockholders' Equity | |
| Preferred stock, $10 par | $ |
| Common stock, $5 par | 1,250,000 |
| Retained earnings | |
| Total stockholders' equity | $4,017,000 |
| Total liabilities and stockholders' equity | $6,607,000 |
Homework Answers
Additional notes:-
As given in the question, from the accounts receivable turnover and inventory turnover, the first amount in the denominator is taken as the closing value.
Average inventory = (Opening inventory + closing inventory)/2
Average account receivable =(Opening account receivable+ closing account receivable)/2

| Balance Sheet | |||
| Dcember 31 20Y6 | |||
| Assets | |||
| Current Assets | |||
| Cash | 823000 | ||
| Marketable securities | 329000 | ||
| Account Receibvables (net) | 714000 | ||
| Inventory | 1072000 | ||
| Prepaid expense | 155000 | ||
| Total Current Assets | 30,93,000 | ||
| Long term Investments | 824000 | ||
| PPE(net) | 2690000 | ||
| Total assets | 66,07,000 | ||
| Liabilities | |||
| Current Liabilities | 900000 | ||
| Long term liabilities | 1690000 | ||
| Total liabilities | 2590000 | ||
| Stockholders equity | |||
| Preferred stock $ 10 par | 487500 | (4017000 - 3529500) | |
| Common stock $5 par | 1250000 | ||
| Retained Earnings | 2279500 | (b/f) | |
| Total stock holders equity | 4017000 | ||
| Total liabilities and stock holders equity | 66,07,000 |
| Compartive Income Statement | ||||
| For the year ended Dec 31 20Y6 and 20Y5 | ||||
| Increase / Decrease | ||||
| 20Y6 | 20Y5 | Amount | % | |
| Sales | 8260000 | 7267000 | 993000 | 12.02% |
| Cost of goods sold | -4100000 | -3444000 | 656000 | 16.00% |
| Gross Profit | 4160000 | 3823000 | 337000 | 8.10% |
| Selling Expenses | 1817200 | 1453200 | 364000 | 20.03% |
| Administartive expenses | 1239000 | 1103000 | 136000 | 10.98% |
| Total opearting expenses | 3056200 | 2556200 | 500000 | 16.36% |
| Operating Income | 1103800 | 1266800 | -163000 | -14.77% |
| Other expenses (interest) | 127000 | 120600 | 6400 | 5.04% |
| Income before income tax expense | 976800 | 1146200 | -169400 | -17.34% |
| Income tax expense | 185460 | 179460 | 6000 | 3.24% |
| Net income | 791340 | 966740 | -175400 | -22.16% |
| Net Income has decreased significantly from 20Y5 to 20Y6 even though Sales has increased. |
| However COGS has also increased which slowed down the increase in Gross Profit |
| In addition Selling expenses has also increased at a faster rate. |
| The company appears to have decrease in net income. |
| Considering the EPS and PE ratio, you can invest in this company. |
| Also it had declared dividend which is an income for the investor. |
Add Answer to:
Mastery Problem: Financial Statement
Analysis
Liquidity and Solvency Measures
Your friend, another accountant, has bet you...
Mastery Problem: Financial Statement Analysis Liquidity and Solvency Measures Your friend, another accountant, has bet you...
 Mastery Problem: Financial Statement Analysis Liquidity and Solvency Measures Your friend, another accountant, has bet you that with your knowledge of accounting and just the computations for common analytical measures, you can figure out many aspects of a company's financial statements. You take the bet! Match each computation to one of the liquidity and solvency measures in the table. (Hint: Begin by looking for simple computations and identifying the amounts in those computations. Look for other measures that use those...
Mastery Problem: Financial Statement Analysis Liquidity and Solvency Measures Your friend, another accountant, has bet you...
Mastery Problem: Financial Statement Analysis Liquidity and Solvency Measures Your friend, another accountant, has bet you that with your knowledge of accounting and just the computations for common analytical measures, you can figure out many aspects of a company's financial statements. You take the bet! Match each computation to one of the liquidity and solvency measures in the table. (Hint: Begin by looking for simple computations and identifying the amounts in those computations. Look for other measures that use those...
Liquidity and Solvency Measures Your friend, another accountant, has bet you that with your knowledge of...
 Liquidity and Solvency Measures Your friend, another accountant, has bet you that with your knowledge of accounting and just the computations for common analytical measures, you can figure out many aspects of a company's financial statements. You take the bet! Match each computation to one of the liquidity and solvency measures in the table. (Hint: Begin by looking for simple computations and identifying the amounts in those computations. Look for other measures that use those amounts.) Liquidity and Solvency Measures...
help please Mastery Problem: Financial Statement Analysis Liquidity and Solvency Measures Your friend, another accountant, has...
 help please
Mastery Problem: Financial Statement Analysis Liquidity and Solvency Measures Your friend, another accountant, has bet you that with your knowledge of accounting and just the computations for common analytical measures, you can figure out many aspects of a company's financial statements. You take the bet! Match each computation to one of the liquidity and solvency measures in the table. (Hint: Begin by looking for simple computations and identifying the amounts in those computations. Look for other measures that...
help please
Mastery Problem: Financial Statement Analysis Liquidity and Solvency Measures Your friend, another accountant, has bet you that with your knowledge of accounting and just the computations for common analytical measures, you can figure out many aspects of a company's financial statements. You take the bet! Match each computation to one of the liquidity and solvency measures in the table. (Hint: Begin by looking for simple computations and identifying the amounts in those computations. Look for other measures that...
Your friend, another accountant, has bet you that with your knowledge of accounting and just the...
 Your friend, another accountant, has bet you that with your knowledge of accounting and just the calculations for common analytical measures, you can figure out many aspects of a company's financial statements. You take the bet! Match each calculation to one of the liquidity and solvency measures in the table. (Hint: Begin by looking for simple calculations and identifying the amounts in those calculations. Look for other measures that use those amounts.) Liquidity and Solvency Measures Calculations $4,100,000($1,072,000+$1,100,000)2] V Inventory...
Mastery Problem HELP ASAP
Mastery Problem: Financial Statement AnalysisLiquidity and Solvency MeasuresYour friend, another accountant, has bet you that with your knowledge of accounting and just the computations for common analytical measures, you can figure out many aspects of a company's financial statements. You take the bet!Match each computation to one of the liquidity and solvency measures in the table. (Hint: Begin by looking for simple computations and identifying the amounts in those computations. Look for other measures that use those amounts.)Liquidity and Solvency MeasuresComputationsWorking capital$3,095,000 – $860,000 Current...
Finance
Mastery Problem: Financial Statement AnalysisLiquidity and Solvency MeasuresYour friend, another accountant, has bet you that with your knowledge of accounting and just the computations for common analytical measures, you can figure out many aspects of a company's financial statements. You take the bet!Match each computation to one of the liquidity and solvency measures in the table. (Hint: Begin by looking for simple computations and identifying the amounts in those computations. Look for other measures that use those amounts.)Liquidity and Solvency Measures ComputationsWorking capital $3,091,000 – $860,000$3,091,000...
there is no question provided, I just need help on the balance sheet Comparative Income Statement...
 there is no question provided,
I just need help on the balance sheet
Comparative Income Statement Use the following comparative income statement form to enter amounts you identify from the computations on the Liquidity and Solvency Measures part and on the Profitability Measures part. Compute any missing amounts and complete the horizontal analysis columns. Enter percentages as decimal amounts, rounded to one decimal place. When rounding, look only at the figure to the right of one decimal place. If <...
there is no question provided,
I just need help on the balance sheet
Comparative Income Statement Use the following comparative income statement form to enter amounts you identify from the computations on the Liquidity and Solvency Measures part and on the Profitability Measures part. Compute any missing amounts and complete the horizontal analysis columns. Enter percentages as decimal amounts, rounded to one decimal place. When rounding, look only at the figure to the right of one decimal place. If <...
Mastery Problem: Your friend, another accountant, has bet you that with your knowledge of accounting and just the computations for common analytical measures, you can figure out many aspects of a company's financial statements. You take the bet!
 Liquidity and Solvency MeasuresYour friend, another accountant, has bet you that with your knowledge
of accounting and just the computations for common analytical measures,
you can figure out many aspects of a company's financial statements.
You take the bet!Match each computation to one of the liquidity and solvency measures in the table. (Hint:
Begin by looking for simple computations and identifying the amounts in
those computations. Look for other measures that use those amounts.)Liquidity and Solvency MeasuresComputationsWorking capitalCurrent ratioQuick ratioAccounts...
Liquidity and Solvency MeasuresYour friend, another accountant, has bet you that with your knowledge
of accounting and just the computations for common analytical measures,
you can figure out many aspects of a company's financial statements.
You take the bet!Match each computation to one of the liquidity and solvency measures in the table. (Hint:
Begin by looking for simple computations and identifying the amounts in
those computations. Look for other measures that use those amounts.)Liquidity and Solvency MeasuresComputationsWorking capitalCurrent ratioQuick ratioAccounts...
Measures of liquidity, Solvency, and Profitability The comparative financial statements of Marshall Inc. are as follows....
Measures of liquidity, Solvency, and Profitability The comparative financial statements of Marshall Inc. are as follows. The market price of Marshall common stock was $ 58 on December 31, 20Y2. Marshall Inc. Comparative Retained Earnings Statement For the Years Ended December 31, 20Y2 and 20Y1 20Y2 20Y1 Retained earnings, January 1 $1,802,125 $1,537,175 Net income 425,600 314,800 Total $2,227,725 $1,851,975 Dividends: On preferred stock $13,300 $13,300 On common stock 36,550 36,550 Total dividends $49,850 $49,850 Retained earnings, December 31 $2,177,875...
 Mastery Problem: Financial Statement Analysis Liquidity and Solvency Measures Your friend, another accountant, has bet you that with your knowledge of accounting and just the computations for common analytical measures, you can figure out many aspects of a company's financial statements. You take the bet! Match each computation to one of the liquidity and solvency measures in the table. (Hint: Begin by looking for simple computations and identifying the amounts in those computations. Look for other measures that use those...
 Liquidity and Solvency Measures Your friend, another accountant, has bet you that with your knowledge of accounting and just the computations for common analytical measures, you can figure out many aspects of a company's financial statements. You take the bet! Match each computation to one of the liquidity and solvency measures in the table. (Hint: Begin by looking for simple computations and identifying the amounts in those computations. Look for other measures that use those amounts.) Liquidity and Solvency Measures...
 help please
Mastery Problem: Financial Statement Analysis Liquidity and Solvency Measures Your friend, another accountant, has bet you that with your knowledge of accounting and just the computations for common analytical measures, you can figure out many aspects of a company's financial statements. You take the bet! Match each computation to one of the liquidity and solvency measures in the table. (Hint: Begin by looking for simple computations and identifying the amounts in those computations. Look for other measures that...
help please
Mastery Problem: Financial Statement Analysis Liquidity and Solvency Measures Your friend, another accountant, has bet you that with your knowledge of accounting and just the computations for common analytical measures, you can figure out many aspects of a company's financial statements. You take the bet! Match each computation to one of the liquidity and solvency measures in the table. (Hint: Begin by looking for simple computations and identifying the amounts in those computations. Look for other measures that...
 Your friend, another accountant, has bet you that with your knowledge of accounting and just the calculations for common analytical measures, you can figure out many aspects of a company's financial statements. You take the bet! Match each calculation to one of the liquidity and solvency measures in the table. (Hint: Begin by looking for simple calculations and identifying the amounts in those calculations. Look for other measures that use those amounts.) Liquidity and Solvency Measures Calculations $4,100,000($1,072,000+$1,100,000)2] V Inventory...
 there is no question provided,
I just need help on the balance sheet
Comparative Income Statement Use the following comparative income statement form to enter amounts you identify from the computations on the Liquidity and Solvency Measures part and on the Profitability Measures part. Compute any missing amounts and complete the horizontal analysis columns. Enter percentages as decimal amounts, rounded to one decimal place. When rounding, look only at the figure to the right of one decimal place. If <...
there is no question provided,
I just need help on the balance sheet
Comparative Income Statement Use the following comparative income statement form to enter amounts you identify from the computations on the Liquidity and Solvency Measures part and on the Profitability Measures part. Compute any missing amounts and complete the horizontal analysis columns. Enter percentages as decimal amounts, rounded to one decimal place. When rounding, look only at the figure to the right of one decimal place. If <...
Most questions answered within 3 hours.
-
An MNE is this kind of industry when competition in one country
is essentially independent of...
asked 1 hour ago -
. For this set of questions, determine what
proportion of a normal distribution is located betweeneach...
asked 1 hour ago -
A college student is employed as a door-to-door newspaper
salesman. Historical data suggests that the student...
asked 2 hours ago -
MATLAB HW 11 problem using Switch Case and Input commands
Write a script file that calculates...
asked 2 hours ago -
Considering gravitational time dilation, calculate the time that
passes in Earth’s surface while 1 hour passes...
asked 3 hours ago -
Minitab Problem: Take the Lake Hume June rainfall data and find
use the processes outlined in...
asked 3 hours ago -
X Company is trying to decide whether to continue using old
equipment to make Product A...
asked 3 hours ago -
IN PYTHON ONLY !! Program 2: Re-work
program #5 (WeeklyHours) from the previous assignment such that...
asked 4 hours ago -
The average length of time between arrivals at a turnpike
toll-booth is 26 seconds. What is...
asked 6 hours ago -
(a) A piston at 6.1 atm contains a gas that occupies a volume of
3.5 L....
asked 7 hours ago -
Please answer true or false. Words
cannot be changed or added in to make it true...
asked 7 hours ago -
An empty test tube weighs 15.923 grams. Then,
MgCl2•6H2O is added into the test tube. After...
asked 7 hours ago