
Homework Answers
The statistical software output for this problem is:
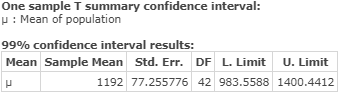
Hence,
a) Option A is correct.
b) 99% confidence interval:
(983.6, 1400.4)
Option C is correct.
Add Answer to:
The following observations are lifetimes (days) subsequent to diagnosis for individuals suffering from blood cancer. -...
The following observations are lifetimes (days) subsequent to diagnosis for individuals suffering from blood cancer. 115...
 The following observations are lifetimes (days) subsequent to diagnosis for individuals suffering from blood cancer. 115 866 1277 1603 182 924 1291 1606 255 984 1357 1696 418 1025 1369 1735 441 1062 1408 1799 462 1063 1456 1815 517 1166 1478 1853 739 1192 1519 1899 744 1222 1578 1926 789 1222 1578 1966 807 1252 1599 (a) Can a confidence interval for true average lifetime be calculated without assuming anything about the nature of the lifetime distribution? Explain...
1. 0.5/2.5 points| Provious Answers DavoreStat9 7.E.012 My Notes Ask Your Teacher The following observations are...
 1. 0.5/2.5 points| Provious Answers DavoreStat9 7.E.012 My Notes Ask Your Teacher The following observations are lifetimes (days) subsequent to diagnosis for individuals suffering from blood cancer 116 865 182 925 256 984 1025 1062 1063 1165 1191 1222 1222 1251 419 442 461 516 739744 789 B08 1278 1291 135B 1369 1408 1456 1478 1519 1578 1578 1599 16041606 1697 1736 1799 1815 1853 1899 1925 1966 (a) Can a confidence interval for true average lifetime be calculated without...
A random sample of 107 lightning flashes in a certain region resulted in a sample average...
 A random sample of 107 lightning flashes in a certain region resulted in a sample average radar echo duration of 0.77 sec and a sample standard deviation of 0.50 sec. Calculate a 99% (two-sided) confidence interval for the true average echo duration u. (Round your answers to two decimal places.) sec Interpret the resulting interval. We are 99% confident that the true population mean lies above this interval. We are 99% confident that this interval contains the true population mean....
Answer the following question A random sample of 103 lightning flashes in a certain region resulted...
 Answer the following question
A random sample of 103 lightning flashes in a certain region resulted in a sample average radar echo duration of 0.77 sec and a sample standard deviation of 0.36 se Calculate a 99% (two-sided) confidence interval for the true average echo duration p. (Round your answers to two decimal places.) Interpret the resulting interval We are 99% confident that this interval does not contain the true population mean. O We are 99% confident that the true...
Answer the following question
A random sample of 103 lightning flashes in a certain region resulted in a sample average radar echo duration of 0.77 sec and a sample standard deviation of 0.36 se Calculate a 99% (two-sided) confidence interval for the true average echo duration p. (Round your answers to two decimal places.) Interpret the resulting interval We are 99% confident that this interval does not contain the true population mean. O We are 99% confident that the true...
A random sample of 109 lightning flashes in a certain region resulted in a sample average...
 A random sample of 109 lightning flashes in a certain region resulted in a sample average radar echo duration of 0.82 sec and a sample standard deviation of 0.41 sec. Calculate a 99% (two-sided) confidence interval for the true average echo duration u. (Give answers accurate to 3 decimal places.) (717 923 X) Interpret the resulting interval. o We are 99% confident that this interval does not contain the true population mean. . We are 99% confident that this interval...
11. 4 points DevoreStat9 7.E.023. My Notes A certain forum reported that in a survey of...
 11. 4 points DevoreStat9 7.E.023. My Notes A certain forum reported that in a survey of 2008 American adults, 27% said they believed in astrology. (a) Calculate a confidence interval at the 99% confidence level for the proportion of all adult Americans who believe in astrology. (Round your answers to three decimal places.) Interpret the resulting interval. we are 99% confident that this interval does not contain the true population mean. 0 we are 99% confident that the true population...
Please Help with BOTH 1) 2) It is important that face masks used by firefighters be...
 Please Help with BOTH
1)
2)
It is important that face masks used by firefighters be able to withstand high temperatures because firefighters commonly work in temperatures of 200-500°F. In a test of one type of mask, 9 of 45 masks had lenses pop out at 250°. Construct a 90% upper confidence limit for the true proportion of masks of this type whose lenses would pop out at 250°. (Round your answers to four decimal places.) You may need to...
Please Help with BOTH
1)
2)
It is important that face masks used by firefighters be able to withstand high temperatures because firefighters commonly work in temperatures of 200-500°F. In a test of one type of mask, 9 of 45 masks had lenses pop out at 250°. Construct a 90% upper confidence limit for the true proportion of masks of this type whose lenses would pop out at 250°. (Round your answers to four decimal places.) You may need to...
MY NOTES A study of the ability of individuals to walk in a straight line reported...
 MY NOTES A study of the ability of individuals to walk in a straight line reported the accompanying data on cadence (strides per second) for a sample of n = 20 randomly selected healthy men. PRACTICE ANOTHER 0.95 0.85 0.92 0.95 0.93 0.85 1.00 0.92 0.85 0.81 0.75 0.93 0.93 1.03 0.93 1.06 1.09 0.96 0.81 0.95 A normal probability plot gives substantial support to the assumption that the population distribution of cadence is approximately normal. A descriptive summary of...
A random sample of size n 200 yielded p 0.50 a. Is the sample size large...
 A random sample of size n 200 yielded p 0.50 a. Is the sample size large enough to use the large sample approximation to construct a confidence interval for p? Explain b. Construct a 95% confidence interval for p C. Interpret the 95% confidence interval d. Explain what is meant by the phrase "95% confidence interval." a. Is the sample large enough? AYes, because np 2 15 and nq2 15 No, because np 2 15 and nq< 15 No, because...
A study of the ability of individuals to walk in a straight line reported the accompanying...
 A study of the ability of individuals to walk in a straight line reported the accompanying data on cadence (strides per second) for a sample of n = 20 randomly selected healthy men. 0.94 0.85 0.92 0.95 0.93 0.86 1.00 0.92 0.85 0.81 0.78 0.93 0.93 1.03 0.93 1.06 1.08 0.96 0.81 0.95 A normal probability plot gives substantial support to the assumption that the population distribution of cadence is approximately normal. A descriptive summary of the data from Minitab...
 The following observations are lifetimes (days) subsequent to diagnosis for individuals suffering from blood cancer. 115 866 1277 1603 182 924 1291 1606 255 984 1357 1696 418 1025 1369 1735 441 1062 1408 1799 462 1063 1456 1815 517 1166 1478 1853 739 1192 1519 1899 744 1222 1578 1926 789 1222 1578 1966 807 1252 1599 (a) Can a confidence interval for true average lifetime be calculated without assuming anything about the nature of the lifetime distribution? Explain...
 1. 0.5/2.5 points| Provious Answers DavoreStat9 7.E.012 My Notes Ask Your Teacher The following observations are lifetimes (days) subsequent to diagnosis for individuals suffering from blood cancer 116 865 182 925 256 984 1025 1062 1063 1165 1191 1222 1222 1251 419 442 461 516 739744 789 B08 1278 1291 135B 1369 1408 1456 1478 1519 1578 1578 1599 16041606 1697 1736 1799 1815 1853 1899 1925 1966 (a) Can a confidence interval for true average lifetime be calculated without...
 A random sample of 107 lightning flashes in a certain region resulted in a sample average radar echo duration of 0.77 sec and a sample standard deviation of 0.50 sec. Calculate a 99% (two-sided) confidence interval for the true average echo duration u. (Round your answers to two decimal places.) sec Interpret the resulting interval. We are 99% confident that the true population mean lies above this interval. We are 99% confident that this interval contains the true population mean....
 Answer the following question
A random sample of 103 lightning flashes in a certain region resulted in a sample average radar echo duration of 0.77 sec and a sample standard deviation of 0.36 se Calculate a 99% (two-sided) confidence interval for the true average echo duration p. (Round your answers to two decimal places.) Interpret the resulting interval We are 99% confident that this interval does not contain the true population mean. O We are 99% confident that the true...
Answer the following question
A random sample of 103 lightning flashes in a certain region resulted in a sample average radar echo duration of 0.77 sec and a sample standard deviation of 0.36 se Calculate a 99% (two-sided) confidence interval for the true average echo duration p. (Round your answers to two decimal places.) Interpret the resulting interval We are 99% confident that this interval does not contain the true population mean. O We are 99% confident that the true...
 A random sample of 109 lightning flashes in a certain region resulted in a sample average radar echo duration of 0.82 sec and a sample standard deviation of 0.41 sec. Calculate a 99% (two-sided) confidence interval for the true average echo duration u. (Give answers accurate to 3 decimal places.) (717 923 X) Interpret the resulting interval. o We are 99% confident that this interval does not contain the true population mean. . We are 99% confident that this interval...
 11. 4 points DevoreStat9 7.E.023. My Notes A certain forum reported that in a survey of 2008 American adults, 27% said they believed in astrology. (a) Calculate a confidence interval at the 99% confidence level for the proportion of all adult Americans who believe in astrology. (Round your answers to three decimal places.) Interpret the resulting interval. we are 99% confident that this interval does not contain the true population mean. 0 we are 99% confident that the true population...
 Please Help with BOTH
1)
2)
It is important that face masks used by firefighters be able to withstand high temperatures because firefighters commonly work in temperatures of 200-500°F. In a test of one type of mask, 9 of 45 masks had lenses pop out at 250°. Construct a 90% upper confidence limit for the true proportion of masks of this type whose lenses would pop out at 250°. (Round your answers to four decimal places.) You may need to...
Please Help with BOTH
1)
2)
It is important that face masks used by firefighters be able to withstand high temperatures because firefighters commonly work in temperatures of 200-500°F. In a test of one type of mask, 9 of 45 masks had lenses pop out at 250°. Construct a 90% upper confidence limit for the true proportion of masks of this type whose lenses would pop out at 250°. (Round your answers to four decimal places.) You may need to...
 MY NOTES A study of the ability of individuals to walk in a straight line reported the accompanying data on cadence (strides per second) for a sample of n = 20 randomly selected healthy men. PRACTICE ANOTHER 0.95 0.85 0.92 0.95 0.93 0.85 1.00 0.92 0.85 0.81 0.75 0.93 0.93 1.03 0.93 1.06 1.09 0.96 0.81 0.95 A normal probability plot gives substantial support to the assumption that the population distribution of cadence is approximately normal. A descriptive summary of...
 A random sample of size n 200 yielded p 0.50 a. Is the sample size large enough to use the large sample approximation to construct a confidence interval for p? Explain b. Construct a 95% confidence interval for p C. Interpret the 95% confidence interval d. Explain what is meant by the phrase "95% confidence interval." a. Is the sample large enough? AYes, because np 2 15 and nq2 15 No, because np 2 15 and nq< 15 No, because...
 A study of the ability of individuals to walk in a straight line reported the accompanying data on cadence (strides per second) for a sample of n = 20 randomly selected healthy men. 0.94 0.85 0.92 0.95 0.93 0.86 1.00 0.92 0.85 0.81 0.78 0.93 0.93 1.03 0.93 1.06 1.08 0.96 0.81 0.95 A normal probability plot gives substantial support to the assumption that the population distribution of cadence is approximately normal. A descriptive summary of the data from Minitab...
Most questions answered within 3 hours.
-
1. When a nearsighted person looks at an object that is in the
distance with their...
asked 10 minutes ago -
QUESTION 8
Both of these statements will store the same value in the
variable $number
$number...
asked 35 minutes ago -
The price of 1 lb of potatoes is $1.75. If all the potatoes sold
today at...
asked 1 hour ago -
Garcia Company issues 20.00%, 15-year bonds with a par value of
$470,000 and semiannual interest payments....
asked 1 hour ago -
In C++ Programming, Try using loops only.
This lab demonstrates the use of the While Loop...
asked 2 hours ago -
Effect of DCMU and sodium azide on Chlamydomonas? We did an
experiment where we had Chlamydomonas...
asked 2 hours ago -
1a) According to the ideal gas law, _______________.
a. a gas has infinite volume at absolute...
asked 4 hours ago -
Oakdale Fashions, Inc. had $245,000 in 2018 taxable income.
Using the tax schedule in Table 2.3...
asked 4 hours ago -
The marketing class at CSUS had an average score of 150. An
educational analyst determined that...
asked 6 hours ago -
Justin Case has purchased a $250 000 home by putting 20 % down
and taking out...
asked 6 hours ago -
1. In a labor market, marginal cost for a firm is
____________.
a. recruiting cost
b....
asked 6 hours ago -
On January 1, 2019, ABC Company issued $60,000,000 of 20-year,
10.5% bonds when the market rate...
asked 7 hours ago