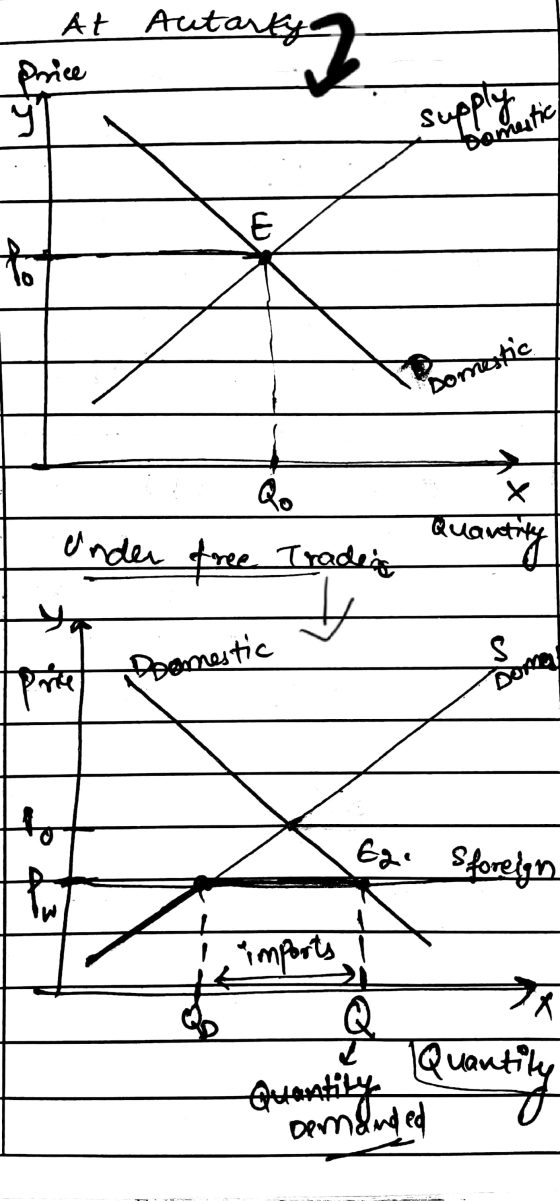
Illustrate on a graph the United States' move from autarky to free trade in the sugar...
Illustrate on a graph the United States' move from autarky to free trade in the sugar market.
Assume the world price for sugar is less than the autarky price in the US.
A fully correct answer will have the following: A fully labeled graph of the US market for sugar including price, quantity, US supply, US demand, the autarky equilibrium, the world price, the quantity demanded under free trade, the quantity supplied under free trade, and the size of imports/exports under free trade.
Homework Answers
Add Answer to:
Illustrate on a graph the United States' move from autarky to
free trade in the sugar...
Illustrate on a graph the United States' move from free trade to free trade with a...
Illustrate on a graph the United States' move from free trade to free trade with a tariff in the sugar market. Assume the world price for sugar is below the autarky price and the world price plus a tariff is below the autarky price. A fully correct answer will have the following: A fully labeled graph of the US market for sugar including labels for price, quantity, US supply, US demand, the world price, the quantity demanded under free trade,...
a. Draw the supply and demand curves for the US market under autarky (no trade) Note...
 a. Draw the supply and demand curves for the US market under autarky (no trade) Note the equilibrium price and quantity b. Draw the supply and demand curves for the ROW market under autarky (no trade). Note the equilibrium price and quantity. Suppose that the two countries open to trade. Describe an arbitrage strategy that will allow you to profit from the price differential between the two markets. Be sure to explain how it will work d. Draw the import...
1) The United States sugar industry has enjoyed trade protection for several years. As a result,...
 1) The United States sugar industry has enjoyed trade protection for several years. As a result, sugar prices in the U.S. are higher than the average world price. Suppose that the domestic demand and domestic supply for sugar are as provided in the table below (assume continuous, linear domestic demand and supply curves which include the following data points for sugar): | Price ($ per Quantity Demanded Domestically Quantity Supplied Domestically pound) (Millions of Pounds per Year) (Millions of Pounds...
1) Suppose the demand and supply curves for the United States and the European Union are...
 1) Suppose the demand and supply curves for the United States and the European Union are given by: Demand (Qa) Supply (s) U.S.A. 250 - 2.5P 25 + 1.25P E.U. 125 - 1.75P 50 + 2P Where P is the relative price of soybeans andQd and Qs refer to the quantity of soybeans demanded and supplied. a. Calculate the equilibrium prices and quantities in autarky. Determine the equilibrium prices and quantities under free trade. b. Plot the domestic and world...
1) The United States sugar industry has enjoyed trade protection for several years. As a result,...
 1) The United States sugar industry has enjoyed trade protection for several years. As a result, sugar prices in the U.S. are higher than the average world price. Suppose that the domestic demand and domestic supply for sugar are as provided in the table below (assume continuous, linear domestic demand and supply curves which include the following data points for sugar): | Price ($ per Quantity Demanded Domestically Quantity Supplied Domestically pound) (Millions of Pounds per Year) (Millions of Pounds...
We have the following demand and supply curves for clothing for the home and foreign economies....
We have the following demand and supply curves for clothing for the home and foreign economies. Home Foreign Supply QC = -20 + 10P QC* = -20 + 20P* Demand DC = 100 - 10 P DC* = 100 - 20P* a. Compute the autarky price and quantities for both countries. b. Compute the world price and quantity traded under free trade. Also compute the quantities supplied and demanded for the home and foreign country individually. c. Draw two graphs,...
please only do problem d e and f thanks! 1) The United States sugar industry has enjoyed trade protection for several y...
 please only do problem d e and f
thanks!
1) The United States sugar industry has enjoyed trade protection for several years. As a result, sugar prices in the U.S. are higher than the average world price. Suppose that the domestic demand and domestic supply for sugar are as provided in the table below (assume continuous, linear domestic demand and supply curves which include the following data points for sugar): | Price ($ per Quantity Demanded Domestically Quantity Supplied Domestically...
please only do problem d e and f
thanks!
1) The United States sugar industry has enjoyed trade protection for several years. As a result, sugar prices in the U.S. are higher than the average world price. Suppose that the domestic demand and domestic supply for sugar are as provided in the table below (assume continuous, linear domestic demand and supply curves which include the following data points for sugar): | Price ($ per Quantity Demanded Domestically Quantity Supplied Domestically...
#4. Assume that the United States, as a steel importing nation, is large enough so that changes in the quantity of its...
 #4. Assume that the United States, as a steel importing nation, is large enough so that changes in the quantity of its imports influence the world price of steel. The U.S. supply and demand schedules for steel are illustrated in the table below, along with the overall amount of steel supplied to U.S. consumers by domestic and foreign producers: Supply and Demand: Tons of Steel (United States) Quantity Supplied (Domestic (Sd)) Quantity Supplied (Domestic + World [Sd+w]) Quantity Demanded (Domestic...
Below is a graph of the market for sugar in the United States. (assume US is...
 Below is a graph of the market for sugar in the United States. (assume US is a small country The World Price of Sugar is 80. USE ONLY NUMBERS ON THE GRAPH 5 130 1 80 110 100 90 8o 70 à00 300 400 500 bo 1. How much sugar is imported with free trade? 2. If a quota of 200 is placed on sugar imports how much sugar is imported? 3. What is the price of sugar in the...
The following graph shows the domestic market for oil in the United States, where Sp is...
 The following graph shows the domestic market for oil in the United States, where Sp is the domestic supply curve, and Dp is the domestic demand curve. Assume the United States is considered a large nation, meaning that changes in the quantity of its imports due to a tariff influence the world price of oil. Under free trade, the United States faced a total supply schedule of SD+w, which shows the quantity of oil that both domestic and foreign producers...
 a. Draw the supply and demand curves for the US market under autarky (no trade) Note the equilibrium price and quantity b. Draw the supply and demand curves for the ROW market under autarky (no trade). Note the equilibrium price and quantity. Suppose that the two countries open to trade. Describe an arbitrage strategy that will allow you to profit from the price differential between the two markets. Be sure to explain how it will work d. Draw the import...
 1) The United States sugar industry has enjoyed trade protection for several years. As a result, sugar prices in the U.S. are higher than the average world price. Suppose that the domestic demand and domestic supply for sugar are as provided in the table below (assume continuous, linear domestic demand and supply curves which include the following data points for sugar): | Price ($ per Quantity Demanded Domestically Quantity Supplied Domestically pound) (Millions of Pounds per Year) (Millions of Pounds...
 1) Suppose the demand and supply curves for the United States and the European Union are given by: Demand (Qa) Supply (s) U.S.A. 250 - 2.5P 25 + 1.25P E.U. 125 - 1.75P 50 + 2P Where P is the relative price of soybeans andQd and Qs refer to the quantity of soybeans demanded and supplied. a. Calculate the equilibrium prices and quantities in autarky. Determine the equilibrium prices and quantities under free trade. b. Plot the domestic and world...
 1) The United States sugar industry has enjoyed trade protection for several years. As a result, sugar prices in the U.S. are higher than the average world price. Suppose that the domestic demand and domestic supply for sugar are as provided in the table below (assume continuous, linear domestic demand and supply curves which include the following data points for sugar): | Price ($ per Quantity Demanded Domestically Quantity Supplied Domestically pound) (Millions of Pounds per Year) (Millions of Pounds...
 please only do problem d e and f
thanks!
1) The United States sugar industry has enjoyed trade protection for several years. As a result, sugar prices in the U.S. are higher than the average world price. Suppose that the domestic demand and domestic supply for sugar are as provided in the table below (assume continuous, linear domestic demand and supply curves which include the following data points for sugar): | Price ($ per Quantity Demanded Domestically Quantity Supplied Domestically...
please only do problem d e and f
thanks!
1) The United States sugar industry has enjoyed trade protection for several years. As a result, sugar prices in the U.S. are higher than the average world price. Suppose that the domestic demand and domestic supply for sugar are as provided in the table below (assume continuous, linear domestic demand and supply curves which include the following data points for sugar): | Price ($ per Quantity Demanded Domestically Quantity Supplied Domestically...
 #4. Assume that the United States, as a steel importing nation, is large enough so that changes in the quantity of its imports influence the world price of steel. The U.S. supply and demand schedules for steel are illustrated in the table below, along with the overall amount of steel supplied to U.S. consumers by domestic and foreign producers: Supply and Demand: Tons of Steel (United States) Quantity Supplied (Domestic (Sd)) Quantity Supplied (Domestic + World [Sd+w]) Quantity Demanded (Domestic...
 Below is a graph of the market for sugar in the United States. (assume US is a small country The World Price of Sugar is 80. USE ONLY NUMBERS ON THE GRAPH 5 130 1 80 110 100 90 8o 70 à00 300 400 500 bo 1. How much sugar is imported with free trade? 2. If a quota of 200 is placed on sugar imports how much sugar is imported? 3. What is the price of sugar in the...
 The following graph shows the domestic market for oil in the United States, where Sp is the domestic supply curve, and Dp is the domestic demand curve. Assume the United States is considered a large nation, meaning that changes in the quantity of its imports due to a tariff influence the world price of oil. Under free trade, the United States faced a total supply schedule of SD+w, which shows the quantity of oil that both domestic and foreign producers...
Most questions answered within 3 hours.
-
Which attribute allows you to specify a custom "thumbnail" for
multimedia elements?
asked 35 minutes ago -
How much 0.1200 M sodium hydroxide solution is need to titrate
14 mL of a 0.100...
asked 10 minutes ago -
An impulse is a change in momentum usually over
a short time. For which of the...
asked 15 minutes ago -
1a)When a 5000-kg roller coaster train full of riders approaches
the loading dock at a speed...
asked 35 minutes ago -
The Poseidon Swim Company produces swim trunks. The average
selling price for one of their swim...
asked 30 minutes ago -
If the elasticity of supply of a good is ∞, then its
A. supply curve is...
asked 16 minutes ago -
Write an application for the Shady Rest Hotel; the program
determines the price of a room....
asked 21 minutes ago -
USE THE FOLLOWING INFORMATION TO ANSWER THE NEXT (6)
QUESTIONS:
The following is a December 31,...
asked 37 minutes ago -
Suppose you plan to invest $5,000 each year (beginning at the
end of this year) into...
asked 27 minutes ago -
What is the cell potential of the following cell at 25
oC? Note Au is a...
asked 28 minutes ago -
DNA to Protein
Describe the mutation that created the HbS allele:
type of mutation, location of...
asked 34 minutes ago -
1. Why are the advantages and disadvantages of object-oriented
databases? 2. What are data marts? How...
asked 54 minutes ago