Compare and contrast the following in details
Compare and contrast the following in details
a. An arithmetic sequence and a geometric sequence.
b. A sequence and a series.
c. Discrete data and continuous data.
d. An explicit and a recursive representation.
Homework Answers
a. Differences & Similarities between arithmetic and geometric sequences:
The differences between arithmetic and geometric sequences is that arithmetic sequences follow terms by adding, while geometric sequences follow terms by multiplying.
The similarities between arithmetic and geometric sequences is that they both follow a certain term pattern that can't be broken.
Geometric sequence's are sequences that are found by multiplying the previous term by a constant. For examples (2,4,8,_,_,_) (9,18,36,_,_,_) (24,48,96,_,_,_) (13,26,52,_,_,_) (8,16,32,_,_,_)
An Arithmetic Sequence is when there is one term, and the next term follows that same sequence. For example, (3,6,9_,_,_) (2,4,6,_,_,_) (10,20,30,_,_,_) (12,24,36,_,_,_) (20,40,60,_,_,_)
b. Difference and similarity between sequence and series:
The list of numbers written in a definite order is called a sequence. The sum of terms of an infinite sequence is called an infinite series. A sequence can be defined as a function whose domain is the set of Natural numbers. Therefore sequence is an ordered list of numbers and series is the sum of a list of numbers. Example of a sequence: 2, 4, 6, 8, 10 … Now if we add them up: 2+4+8+10+ … This is a series.
The sequence is defined as the collection of numbers or objects that follow a definite pattern. When the elements of the sequence are added together, they are known as series.
c. Comparison between discrete data and continuous data:
Discrete - Discrete data is one that has clear spaces between values, countable, It can take only distinct or separate values, graphical representation is bar graph, Tabulation is known as Ungrouped frequency distribution,Example- Days of the week.
Continuous - Continuous data is one that falls on a continuous sequence, measurable, It can take any value in some interval, graphical representation is histogram, Tabulation is known as Grouped frequency distribution, Example- Market price of a product
Consider the Fibonacci sequence.
Consider the Fibonacci sequence.a. Express it recursively.b. Search the web for the explicit formula for a Fibonacci sequence term. Include the source of where you found the formula in APA style formatting.c. Evaluate the explicit formula to find the 20th and 50th term of Fibonacci sequence.https://gyazo.com/83835d0d05d4a61e61b66c44afe07c78
Explain how DSL and Cable modem works in details; b) Compare and contrast DSL and Cable...
Explain how DSL and Cable modem works in details; b) Compare and contrast DSL and Cable modem
iv. Categorical random variable contrast with numerical random variable. v. Compare discrete data from continuous data....
iv. Categorical random variable contrast with numerical random variable. v. Compare discrete data from continuous data. saw. Detail the difference between nominal and ordinal scale. vii. Detail the difference between interval and ratio scale. viii. Explain the main reasons for obtaining data. ix. What is the difference between probabilistic and non-probabilistic sampling? x. What are some potential risks when using fishbowl methods to select a simple random sample? xi. Mention the difference between sampling with replacement and sampling without replacement...
Compare/contrast question. Compare and contrast the COVID-19 virus with one of the following viruses (your choice):...
 Compare/contrast question. Compare and contrast the COVID-19 virus with one of the following viruses (your choice): rhinovirus (common cold), influenza virus or SARS virus. You can do research on the Internet to complete this answer. Please write one comparison sentence that shows a similarity between the two viruses. No points for saying they are both viruses. Then write 2 contrast sentences that show ways in which the two viruses are different. HTML Editora B A 1 1 I - D...
Determine the period of each of the following periodic relations, and whether the relation is a function or not.
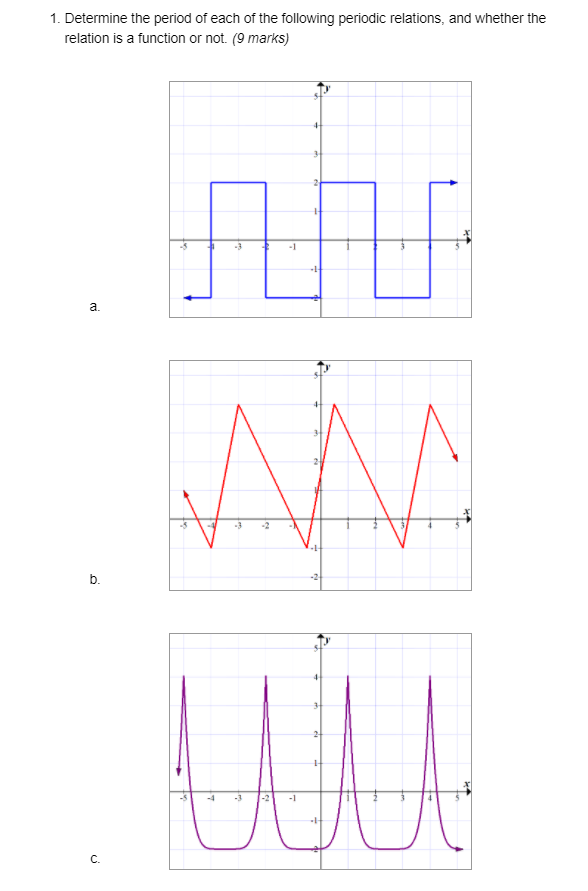 Determine the period of each of the following periodic relations, and whether the relation is a function or not. https://i.gyazo.com/bd12fa6a6a045a6b880f161d12b77d8b.png a. https://gyazo.com/635e88d3e318e143251d67fe445b69fe b. https://gyazo.com/75176d7e67bb7f8d19c0b08993e724fc c. https://gyazo.com/da4dfae0227b8ee777c1ea8de4904a71
Compare and contrast the economic issues involved in each of the following pairs of terms: 25...
Compare and contrast the economic issues involved in each of the following pairs of terms: 25 points. A. Rule of reason versus illegal per se - compare them - contrast them B. Antitrust policy versus regulation and deregulation - compare them - contrast them
The following are annual rates of return for U.S. government T-bills and U.K. common stocks. Year...
The following are annual rates of return for U.S. government T-bills and U.K. common stocks. Year U.S Government T-Bills U.K Government Common Stock Year US Govt T-bills UK Common Stock 2012 0.063 0.150 2013 0.081 0.043 2014 0.076 0.374 2015 0.090 0.192 2016 0.085 0.106 a. Compute the arithmetic mean rate of return and standard deviation of rates of return for the two series. b. Discuss these two alternative investments in terms of their arithmetic average rates of return and...
Compare and contrast the third multiplication algorithm with Booth’s Algorithm for the following 8-bit numbers. Use...
Compare and contrast the third multiplication algorithm with Booth’s Algorithm for the following 8-bit numbers. Use A = (0001 1110)2 for the multiplier and B = (0010 0010)2 for the multiplicand. Determine AxB using each algorithm. Which algorithm uses more arithmetic operations? Which algorithm is more efficient for AxB? Recall that shifts are more efficient than adds. Please read the question carefully, and show the step for both third multiplication algorithm and Booth’s Algorithm. Please show all the steps and...
Visual Text: 1. Compare and contrast the following portraits. You can identify them as Left, Middle,...
 Visual Text: 1. Compare and contrast the following portraits. You can identify them as Left, Middle, Right. 2. Describe each one by using sensory details, the tone or mood the portraits present 3. Imagine who one of these men are and write a brief (two sentences) biography.
Compare and contrast meiosis I and meiosis II based on the following: A. ) Interphase and...
Compare and contrast meiosis I and meiosis II based on the following: A. ) Interphase and checkpoints B.) Chromosome number of daughter cells and how those chromosomes separate C.) Final number of daughter cells.
 Compare/contrast question. Compare and contrast the COVID-19 virus with one of the following viruses (your choice): rhinovirus (common cold), influenza virus or SARS virus. You can do research on the Internet to complete this answer. Please write one comparison sentence that shows a similarity between the two viruses. No points for saying they are both viruses. Then write 2 contrast sentences that show ways in which the two viruses are different. HTML Editora B A 1 1 I - D...
 Visual Text: 1. Compare and contrast the following portraits. You can identify them as Left, Middle, Right. 2. Describe each one by using sensory details, the tone or mood the portraits present 3. Imagine who one of these men are and write a brief (two sentences) biography.
Most questions answered within 3 hours.
-
A check-processing center uses exponential smoothing to forecast
the number of incoming checks each month. The...
asked 6 minutes ago -
Teams with high levels of ______ and ______ deal with task
conflict better than those without...
asked 18 minutes ago -
Create a C++ project called lab3b and add the following source
code init_struct.cpp to the project....
asked 29 minutes ago -
12.
A budget that can be easily adjusted to show budgeted revenues,
costs, and cash flows...
asked 37 minutes ago -
________ unemployment changes slowly and depends on
________.
Select one:
a. Frictional; the rate at which...
asked 1 hour ago -
These surveys collect information in low- and
middle-income countries regarding the total fertility rate and the...
asked 1 hour ago -
I need to determine the concentration of hydrogen peroxide in a
solution using titrimetric analysis
25...
asked 1 hour ago -
Your are the Vice-President of operations for a New Orleans food
chain. In the aftermath of...
asked 1 hour ago -
Create a flowchart and a program; test the program. Program
Requirements.
- There are 10 members...
asked 1 hour ago -
Which of the following is not a sensory receptor?
a. a hair cell
b. a rod
c. a...
asked 1 hour ago -
Does the launch speed depend significantly upon the launching
angle? Is it reasonable?
asked 2 hours ago -
A disc of moment of inertia 3.00 kgm2 is rotating with angular
velocity 2.00 rad/s about...
asked 1 hour ago