
Homework Answers


 Summary:
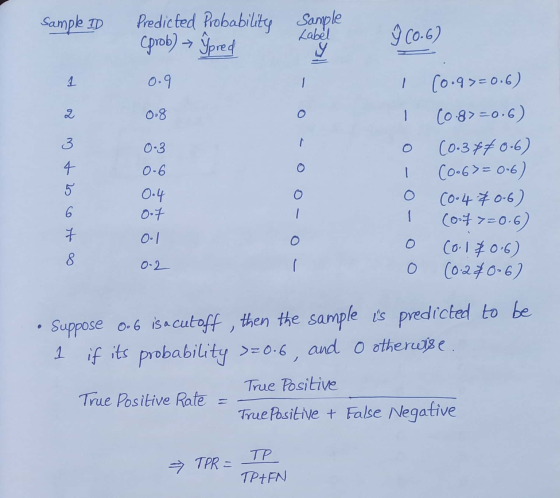
We have seen how to calculate TPR and FPR. Considered some
threshold values to calculate TPR and FPR and noted down every pair
of (TPR, FPR). Represented FPR on X-axis and TPR on Y-axis
Summary:
We have seen how to calculate TPR and FPR. Considered some
threshold values to calculate TPR and FPR and noted down every pair
of (TPR, FPR). Represented FPR on X-axis and TPR on Y-axis
Add Answer to:
Question 3 30 pts Given the following predictive results: Sample ID (id) Predicted Probability (prob) Sample...
Sample ID Predicted Value Sample Label 1 .9 0 2 .7 1 3 .5 1 4...
Sample ID Predicted Value Sample Label 1 .9 0 2 .7 1 3 .5 1 4 .8 1 5 .4 0 6 .3 1 (a) Using 0.5 as a cutoff, namely >=0.5 then predict the sample as 1, and 0 otherwise. Please compute true positive rate and the false positive rate. (b) please compute its AUC manually https://www.coursehero.com/file/27125786/Fall-16-Quiz-5pdf/ This study re
Which of the following distributions is(are) valid discrete probability distribution(s)? 2. 3. 4. X p(x) X...
 Which of the following distributions is(are) valid discrete probability distribution(s)? 2. 3. 4. X p(x) X P(X) X p(x) X P(X) 0.3 0 0.3 0 0.2 0 0.1 1 0.4 1 -0.2 1 0.7 1 0.1 2 0.3 2 0.9 2 0.2 N 0.8 O All are valid O 1,3, and 4 only 1 and 4 only 1 only 4 only
Help please This Question: 2 pts 22 o Consider the following probability distribution: P(x) 0.1 2...
 Help please
This Question: 2 pts 22 o Consider the following probability distribution: P(x) 0.1 2 0.2 0.3 What must be the value of P(2) if the distribution is valid? O A. 0.4 O B. 0.5 O C. 0.2 OD, 0.6 What is the mean of the probability distribution? O A. 2.7 O B. 2.0 OC. 2.9 OD. 2.5 Click to select your answer
Help please
This Question: 2 pts 22 o Consider the following probability distribution: P(x) 0.1 2 0.2 0.3 What must be the value of P(2) if the distribution is valid? O A. 0.4 O B. 0.5 O C. 0.2 OD, 0.6 What is the mean of the probability distribution? O A. 2.7 O B. 2.0 OC. 2.9 OD. 2.5 Click to select your answer
please answer all question (2-5) thanks Question 2 1 pts As the number of hours a...
 please answer all question (2-5) thanks
Question 2 1 pts As the number of hours a student studies increases, the number of errors made on the exam decreases. There is a strong relationship between these variables. Select the value for the pearson correlation (r) that would be appropriate 0-0.7 0-0.4 o 0.6 o 1.0 Question 3 1 pts The following APA summary was reported for a one-sample t-test (two-tailed, alpha = .05). t(15) = 3.3, p = .003 Which of...
please answer all question (2-5) thanks
Question 2 1 pts As the number of hours a student studies increases, the number of errors made on the exam decreases. There is a strong relationship between these variables. Select the value for the pearson correlation (r) that would be appropriate 0-0.7 0-0.4 o 0.6 o 1.0 Question 3 1 pts The following APA summary was reported for a one-sample t-test (two-tailed, alpha = .05). t(15) = 3.3, p = .003 Which of...
Lesson 6.2.4: Binomial Distribution and Sample Proportions A sample proportion, such as the one computed in...
 Lesson 6.2.4: Binomial Distribution and Sample Proportions A sample proportion, such as the one computed in Question 4, is equal to a number of successes (x), divided by the sample size (n). The notation for a sample proportion is p, and it is computed by the formula p = Each value of x corresponds to a unique sample proportion ( p ), as computed by this formula. For example, x = 1 implies p = + - 0.10. These events,...
The following are quality control data for a manufacturing process at Kensport Chemical Company. The data...
 The following are quality control data for a manufacturing process at Kensport Chemical Company. The data show the temperature in degrees centigrade at five points in time during a manufacturing cycle. Sample x R 1 95.72 1.0 2 95.24 0.9 3 95.18 0.9 4 95.48 0.4 5 95.46 0.5 6 95.32 1.1 7 95.40 1.0 8 95.44 0.3 9 95.08 0.2 9 10 10 95.50 0.6 11 95.80 0.6 12 95.22 0.2 13 95.60 1.3 14 95.22 0.5 15 95.04...
Find the probability and interpret the results. If convenient, use technology to find the probability. During...
 Find the probability and interpret the results. If convenient, use technology to find the probability. During a certain week the mean price of gasoline was $2 717 per gallon. A random sample of 38 gas stations is drawn from this population. What is the probability that the mean price for the sample was between S2 699 and S2 718 that week? Assume ơ-SO 049 EE Click the icon to view page 1 of the standard normal table EE Click the...
Question 2 and Questions 3. All letter parts with detailed step by step answers please. 2...
 Question 2 and Questions 3. All letter parts with detailed
step by step answers please.
2 (20 pts + 5 pts) You are a financial analyst and use automotive company and its stock Y 5) and the company's monthly sales thes e o is the tablete Rate of return52311 um 5. 231415 Sales evaluation oodood 56759 10 11 12 1 6171. 710 d had pod a. Please calculate the geometrie man rate 2019 for the stock capa classes, build a...
Question 2 and Questions 3. All letter parts with detailed
step by step answers please.
2 (20 pts + 5 pts) You are a financial analyst and use automotive company and its stock Y 5) and the company's monthly sales thes e o is the tablete Rate of return52311 um 5. 231415 Sales evaluation oodood 56759 10 11 12 1 6171. 710 d had pod a. Please calculate the geometrie man rate 2019 for the stock capa classes, build a...
please explain 3.3) [8 pts] A sample of 29 randomly selected automobile owners were asked to...
 please explain
3.3) [8 pts] A sample of 29 randomly selected automobile owners were asked to keep a record of the kilometers they travel. The random sample showed an average of 28,350 kilometers and a standard deviation of 5,237 kilometers. Assuming the underlying population is normally distributed, test the hypothesis that automobiles are driven on average more than 28,000 kilometers per year at the 10% level. Hou = 28,000 Hu> 28,000 First, specify: "If {inequality} we fail to reject the...
please explain
3.3) [8 pts] A sample of 29 randomly selected automobile owners were asked to keep a record of the kilometers they travel. The random sample showed an average of 28,350 kilometers and a standard deviation of 5,237 kilometers. Assuming the underlying population is normally distributed, test the hypothesis that automobiles are driven on average more than 28,000 kilometers per year at the 10% level. Hou = 28,000 Hu> 28,000 First, specify: "If {inequality} we fail to reject the...
Po 5.4.18-T Question Help The population mean and standard deviation are given below. Find the indicated...
 Po 5.4.18-T Question Help The population mean and standard deviation are given below. Find the indicated probability and determine whether a sample mean in the given range below would be considered unusual. If convenient, use technology to find the probability For a sample of n-36, find the probability of a sample mean being less than 12,750 or greater than 12,753 when 12,750 and ơ-2.3 For the given sample, the probability of a sample mean being less than 12,750 or greater...
 Which of the following distributions is(are) valid discrete probability distribution(s)? 2. 3. 4. X p(x) X P(X) X p(x) X P(X) 0.3 0 0.3 0 0.2 0 0.1 1 0.4 1 -0.2 1 0.7 1 0.1 2 0.3 2 0.9 2 0.2 N 0.8 O All are valid O 1,3, and 4 only 1 and 4 only 1 only 4 only
 Help please
This Question: 2 pts 22 o Consider the following probability distribution: P(x) 0.1 2 0.2 0.3 What must be the value of P(2) if the distribution is valid? O A. 0.4 O B. 0.5 O C. 0.2 OD, 0.6 What is the mean of the probability distribution? O A. 2.7 O B. 2.0 OC. 2.9 OD. 2.5 Click to select your answer
Help please
This Question: 2 pts 22 o Consider the following probability distribution: P(x) 0.1 2 0.2 0.3 What must be the value of P(2) if the distribution is valid? O A. 0.4 O B. 0.5 O C. 0.2 OD, 0.6 What is the mean of the probability distribution? O A. 2.7 O B. 2.0 OC. 2.9 OD. 2.5 Click to select your answer
 please answer all question (2-5) thanks
Question 2 1 pts As the number of hours a student studies increases, the number of errors made on the exam decreases. There is a strong relationship between these variables. Select the value for the pearson correlation (r) that would be appropriate 0-0.7 0-0.4 o 0.6 o 1.0 Question 3 1 pts The following APA summary was reported for a one-sample t-test (two-tailed, alpha = .05). t(15) = 3.3, p = .003 Which of...
please answer all question (2-5) thanks
Question 2 1 pts As the number of hours a student studies increases, the number of errors made on the exam decreases. There is a strong relationship between these variables. Select the value for the pearson correlation (r) that would be appropriate 0-0.7 0-0.4 o 0.6 o 1.0 Question 3 1 pts The following APA summary was reported for a one-sample t-test (two-tailed, alpha = .05). t(15) = 3.3, p = .003 Which of...
 Lesson 6.2.4: Binomial Distribution and Sample Proportions A sample proportion, such as the one computed in Question 4, is equal to a number of successes (x), divided by the sample size (n). The notation for a sample proportion is p, and it is computed by the formula p = Each value of x corresponds to a unique sample proportion ( p ), as computed by this formula. For example, x = 1 implies p = + - 0.10. These events,...
 The following are quality control data for a manufacturing process at Kensport Chemical Company. The data show the temperature in degrees centigrade at five points in time during a manufacturing cycle. Sample x R 1 95.72 1.0 2 95.24 0.9 3 95.18 0.9 4 95.48 0.4 5 95.46 0.5 6 95.32 1.1 7 95.40 1.0 8 95.44 0.3 9 95.08 0.2 9 10 10 95.50 0.6 11 95.80 0.6 12 95.22 0.2 13 95.60 1.3 14 95.22 0.5 15 95.04...
 Find the probability and interpret the results. If convenient, use technology to find the probability. During a certain week the mean price of gasoline was $2 717 per gallon. A random sample of 38 gas stations is drawn from this population. What is the probability that the mean price for the sample was between S2 699 and S2 718 that week? Assume ơ-SO 049 EE Click the icon to view page 1 of the standard normal table EE Click the...
 Question 2 and Questions 3. All letter parts with detailed
step by step answers please.
2 (20 pts + 5 pts) You are a financial analyst and use automotive company and its stock Y 5) and the company's monthly sales thes e o is the tablete Rate of return52311 um 5. 231415 Sales evaluation oodood 56759 10 11 12 1 6171. 710 d had pod a. Please calculate the geometrie man rate 2019 for the stock capa classes, build a...
Question 2 and Questions 3. All letter parts with detailed
step by step answers please.
2 (20 pts + 5 pts) You are a financial analyst and use automotive company and its stock Y 5) and the company's monthly sales thes e o is the tablete Rate of return52311 um 5. 231415 Sales evaluation oodood 56759 10 11 12 1 6171. 710 d had pod a. Please calculate the geometrie man rate 2019 for the stock capa classes, build a...
 please explain
3.3) [8 pts] A sample of 29 randomly selected automobile owners were asked to keep a record of the kilometers they travel. The random sample showed an average of 28,350 kilometers and a standard deviation of 5,237 kilometers. Assuming the underlying population is normally distributed, test the hypothesis that automobiles are driven on average more than 28,000 kilometers per year at the 10% level. Hou = 28,000 Hu> 28,000 First, specify: "If {inequality} we fail to reject the...
please explain
3.3) [8 pts] A sample of 29 randomly selected automobile owners were asked to keep a record of the kilometers they travel. The random sample showed an average of 28,350 kilometers and a standard deviation of 5,237 kilometers. Assuming the underlying population is normally distributed, test the hypothesis that automobiles are driven on average more than 28,000 kilometers per year at the 10% level. Hou = 28,000 Hu> 28,000 First, specify: "If {inequality} we fail to reject the...
 Po 5.4.18-T Question Help The population mean and standard deviation are given below. Find the indicated probability and determine whether a sample mean in the given range below would be considered unusual. If convenient, use technology to find the probability For a sample of n-36, find the probability of a sample mean being less than 12,750 or greater than 12,753 when 12,750 and ơ-2.3 For the given sample, the probability of a sample mean being less than 12,750 or greater...
Most questions answered within 3 hours.
-
Add 1ml of 0.18M of HCl (aq) to 1ml of 0.2M of [Ag(NH3)2]Br
(aq).
Write the...
asked 3 minutes ago -
1. Smoke detectors use Am-241, an alpha emitter, to detect smoke
particles. A parent is concerned...
asked 7 minutes ago -
Scenario: Web application developed to capture customers
demographic and financial information for filling their taxes. This...
asked 11 minutes ago -
Which of the following statements are true?
1. Glass is mostly silicon dioxide and so when...
asked 33 minutes ago -
Korman Company has the following securities in its portfolio of
equity securities on December 31, 2018:...
asked 33 minutes ago -
Using the 12th edition of Language Awareness,
complete the following assignment:
After reading Akiba Solomon's "Thugs....
asked 44 minutes ago -
For all problems assume an effective monthly interest rate of 1%
unless otherwise indicated in the...
asked 55 minutes ago -
Fix all syntax and logical errors for the following program.
Please generate the correct output. //...
asked 1 hour ago -
The USPS sells money orders identified by an 11 –digit number
x1, x2, …, x11. The...
asked 1 hour ago -
Provide an example of equilibrium in relation to
Newton’s First and Second Laws. Explain your answer....
asked 1 hour ago -
You are __________ to commit a Type I error using the 0.05 level
of significance than...
asked 1 hour ago -
1. the following results are obtained:
200
kiwi
575 wild-type
What can we conclude about the...
asked 1 hour ago