
Homework Answers
Add Answer to:
The populations P (in thousands) of a certain city from 2000 through 2008 can be modeled...
The populations P (in thousands) of a certain city from 2000 through 2008 can be modeled...
 The populations P (in thousands) of a certain city from 2000 through 2008 can be modeled by P = 281.81ekt, where t is the year, with t = 0 corresponding to 2000. In 2006, the population was about 364,000. (a) Find the value of k for the model. Round your result to four decimal places. k= (b) Use your model to predict the population in 2015. (Round your answer to the nearest person.) P= thousand
the population P (in thousands) of a certain city from 2000 through 2008 can be modeled...
 the
population P (in thousands) of a certain city from 2000 through
2008 can be modeled by
p=280.84e^kt
where t is the year with t=0
corresponding to 2000.
in 2006 the population was about 360,000.
(a) finf the value of k for the model. round your result to
four decimal places
(b) use your model to predict the population in 2015(round
your answer to the nearest person
p=??
16. 1/2 points Previous Answers LarATRMRP7 4.5.0183/30 Submissions Used My Note Corplete...
the
population P (in thousands) of a certain city from 2000 through
2008 can be modeled by
p=280.84e^kt
where t is the year with t=0
corresponding to 2000.
in 2006 the population was about 360,000.
(a) finf the value of k for the model. round your result to
four decimal places
(b) use your model to predict the population in 2015(round
your answer to the nearest person
p=??
16. 1/2 points Previous Answers LarATRMRP7 4.5.0183/30 Submissions Used My Note Corplete...
0/0.39 POINTS PREVIOUS ANSWERS 9/30 Submissions Used The populations P (in thousands) of a certain city...
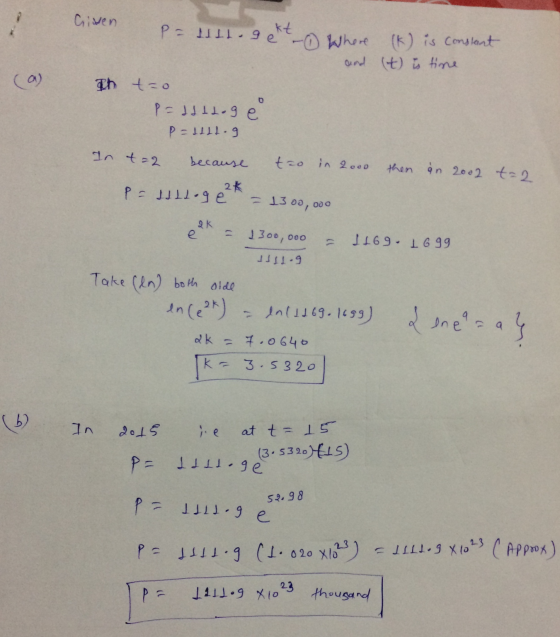
 0/0.39 POINTS PREVIOUS ANSWERS 9/30 Submissions Used The populations P (in thousands) of a certain city from 2000 through 2008 can be modeled by P= 1115.2ekt, where t is the year, with t = 0 corresponding to 2000. In 2002, the population was about 1,400,000. (a) Find the value of k for the model. Round your result to four decimal places. k = Enter a number (b) Use your model to predict the population in 2015. (Round your answer to...
19&20 The population P (in thousands) of Reno, Nevada from 2000 through 2007 can be modeled...
 19&20
The population P (in thousands) of Reno, Nevada from 2000 through 2007 can be modeled by P = 346.8e" where / represents the year, with 1 0 corresponding to 2000. In 2005, the population of Reno was about 395,000. According to the model, during what year will the population reach 486,000.00 O a 2009 Ob.2005 O c.2021 Od 2013 Oe.2017 QUESTION 20 Use the Remainder Theorem and synthetic division to find the function value. Verify your answers using another...
19&20
The population P (in thousands) of Reno, Nevada from 2000 through 2007 can be modeled by P = 346.8e" where / represents the year, with 1 0 corresponding to 2000. In 2005, the population of Reno was about 395,000. According to the model, during what year will the population reach 486,000.00 O a 2009 Ob.2005 O c.2021 Od 2013 Oe.2017 QUESTION 20 Use the Remainder Theorem and synthetic division to find the function value. Verify your answers using another...
The population of a certain state (in thousands) from 1990 (t = 0) to 2000 (t=...
 The population of a certain state (in thousands) from 1990 (t = 0) to 2000 (t= 10) is modeled by the polynomial p(t) = -0.376+ 108t + 7066. a. Determine the average growth rate from 1990 to 2000. b. What was the growth rate for this state in 1994 (t = 4) and 2000 (t = 10)? c. Use a graphing utility to graph p' for Osts 10. What does this graph tell you about population growth in this state...
2. Suppose the number of people infected with COVID-19 worldwide in thousands can be modeled by...
 2. Suppose the number of people infected with COVID-19 worldwide in thousands can be modeled by P = 10.58e1.017, where t is the time in months, with t = 0 corresponding to the beginning of February. (a) Let t = 1.5 to model predict the amount of people infected as of this week. (b) Predict the infected population in April, May, and June using the model and t = 2,3, and 4. Why is the growth from April to May...
5.6.97 A city's population in thousands during year x is modeled by P(x)= 125(1.012)* 1992 Estimate...
 5.6.97 A city's population in thousands during year x is modeled by P(x)= 125(1.012)* 1992 Estimate the year when the city's population reached 145 thousand. In what year did the population reach 145 thousand? (Round down to the nearest year as needed.)
Question 6 of 29 Step 1 of 1 00:56:23 The population of a certain inner-city area...
 Question 6 of 29 Step 1 of 1 00:56:23 The population of a certain inner-city area is estimated to be declining according to the model P) 452,000e-0014 where t is the number of years from the present. What does this model predict the population will be in 8 years? Round to the nearest person.
The population of a certain inner city is to be declining according for the madel P(t)...
 The population of a certain inner city is to be declining according for the madel P(t) = 446,00004 t is the number of years present What does the model fredict porulation will he in byears found to nearest person andha
Topic: The graph shows the sales (in millions of dollars) of Peet's Coffee & Tea from 2000 through 2008. Le...
 Topic: The graph shows the sales (in millions of dollars) of Peet's Coffee & Tea from 2000 through 2008. Let f(x) represent the sales in year x. a) Find (f(2008)-f(2000) y (2008-2000) and interpret the results in the context of the problem. b) An approximate model for the function is 2.48r25.71t +84.0 where 0 st 8 S(C) where S is the sales (in millions of dollars) and t 0 represents 2000. Complete the table and compare the results with the...
 The populations P (in thousands) of a certain city from 2000 through 2008 can be modeled by P = 281.81ekt, where t is the year, with t = 0 corresponding to 2000. In 2006, the population was about 364,000. (a) Find the value of k for the model. Round your result to four decimal places. k= (b) Use your model to predict the population in 2015. (Round your answer to the nearest person.) P= thousand
 the
population P (in thousands) of a certain city from 2000 through
2008 can be modeled by
p=280.84e^kt
where t is the year with t=0
corresponding to 2000.
in 2006 the population was about 360,000.
(a) finf the value of k for the model. round your result to
four decimal places
(b) use your model to predict the population in 2015(round
your answer to the nearest person
p=??
16. 1/2 points Previous Answers LarATRMRP7 4.5.0183/30 Submissions Used My Note Corplete...
the
population P (in thousands) of a certain city from 2000 through
2008 can be modeled by
p=280.84e^kt
where t is the year with t=0
corresponding to 2000.
in 2006 the population was about 360,000.
(a) finf the value of k for the model. round your result to
four decimal places
(b) use your model to predict the population in 2015(round
your answer to the nearest person
p=??
16. 1/2 points Previous Answers LarATRMRP7 4.5.0183/30 Submissions Used My Note Corplete...
 0/0.39 POINTS PREVIOUS ANSWERS 9/30 Submissions Used The populations P (in thousands) of a certain city from 2000 through 2008 can be modeled by P= 1115.2ekt, where t is the year, with t = 0 corresponding to 2000. In 2002, the population was about 1,400,000. (a) Find the value of k for the model. Round your result to four decimal places. k = Enter a number (b) Use your model to predict the population in 2015. (Round your answer to...
 19&20
The population P (in thousands) of Reno, Nevada from 2000 through 2007 can be modeled by P = 346.8e" where / represents the year, with 1 0 corresponding to 2000. In 2005, the population of Reno was about 395,000. According to the model, during what year will the population reach 486,000.00 O a 2009 Ob.2005 O c.2021 Od 2013 Oe.2017 QUESTION 20 Use the Remainder Theorem and synthetic division to find the function value. Verify your answers using another...
19&20
The population P (in thousands) of Reno, Nevada from 2000 through 2007 can be modeled by P = 346.8e" where / represents the year, with 1 0 corresponding to 2000. In 2005, the population of Reno was about 395,000. According to the model, during what year will the population reach 486,000.00 O a 2009 Ob.2005 O c.2021 Od 2013 Oe.2017 QUESTION 20 Use the Remainder Theorem and synthetic division to find the function value. Verify your answers using another...
 The population of a certain state (in thousands) from 1990 (t = 0) to 2000 (t= 10) is modeled by the polynomial p(t) = -0.376+ 108t + 7066. a. Determine the average growth rate from 1990 to 2000. b. What was the growth rate for this state in 1994 (t = 4) and 2000 (t = 10)? c. Use a graphing utility to graph p' for Osts 10. What does this graph tell you about population growth in this state...
 2. Suppose the number of people infected with COVID-19 worldwide in thousands can be modeled by P = 10.58e1.017, where t is the time in months, with t = 0 corresponding to the beginning of February. (a) Let t = 1.5 to model predict the amount of people infected as of this week. (b) Predict the infected population in April, May, and June using the model and t = 2,3, and 4. Why is the growth from April to May...
 5.6.97 A city's population in thousands during year x is modeled by P(x)= 125(1.012)* 1992 Estimate the year when the city's population reached 145 thousand. In what year did the population reach 145 thousand? (Round down to the nearest year as needed.)
 Question 6 of 29 Step 1 of 1 00:56:23 The population of a certain inner-city area is estimated to be declining according to the model P) 452,000e-0014 where t is the number of years from the present. What does this model predict the population will be in 8 years? Round to the nearest person.
 The population of a certain inner city is to be declining according for the madel P(t) = 446,00004 t is the number of years present What does the model fredict porulation will he in byears found to nearest person andha
 Topic: The graph shows the sales (in millions of dollars) of Peet's Coffee & Tea from 2000 through 2008. Let f(x) represent the sales in year x. a) Find (f(2008)-f(2000) y (2008-2000) and interpret the results in the context of the problem. b) An approximate model for the function is 2.48r25.71t +84.0 where 0 st 8 S(C) where S is the sales (in millions of dollars) and t 0 represents 2000. Complete the table and compare the results with the...
Most questions answered within 3 hours.
-
Jor-el throws a ball upward from the top of a 728 foot building
on the planet...
asked 1 minute from now -
Draw the Lewis dot structures for the following molecules. None
of the atoms have a formal...
asked 50 seconds ago -
What does it mean when an element is radioactive?
a.
It means the element is changing...
asked 1 minute ago -
A company deposits $6,000 in a bank at the end of every year for
10 years....
asked 50 seconds ago -
What are some strategies for eliminating service barriers?
By using your knowledge of
behavioral styles, please...
asked 8 minutes ago -
What are the decimal numbers for 159, 150, 200, 113, 225, 87,
106, 81 when converted...
asked 17 minutes ago -
Calculate and plot the number and weight distributions of x-mers
found in a step-growth polymerization for...
asked 36 minutes ago -
The Baily Corporation has developed a specialized software
program that improves inventory control capability. The following...
asked 40 minutes ago -
Problem 5-4A (Part Level Submission) Wolford Department Store is
located in midtown Metropolis. During the past...
asked 40 minutes ago -
Preparation of Benzoic Acid using a Grignard Reagent URGENT
1. During your Grignard formation, a small...
asked 1 hour ago -
A uniform magnetic field is perpendicular to the plane of a wire
loop. If the loop...
asked 1 hour ago -
At the peak of your career, your were earning $120,000 and
holding a top level position....
asked 1 hour ago