
Homework Answers
The statistical software output for this problem is :
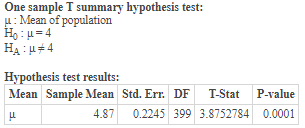
Option C) is correct.
Test statistics = 3.88
P-value = 0.000
reject , sufficient , is
Add Answer to:
A data set lists earthquake depths. The summary statistics are n= 400, X = 4.87 km,...
A data set lists earthquake depths. The summary statistics are n 400, x=4.46 km, s=4.43 km....
 A data set lists earthquake depths. The summary statistics are n 400, x=4.46 km, s=4.43 km. Use a 0.01 significance level to test the claim of a seismologist that these earthquakes are from a population with a mean equal to 4.00. Assume that a simple random sample has been selected. Identify the nul and alternative hypotheses, test statistic, P-value, and state the final conclusion that addresses the original claim. What are the null and alternative hypotheses? O A. Ho:u=4.00 km...
A data set lists earthquake depths. The summary statistics are n=500, x= 6.83 km, s =...
 A data set lists earthquake depths. The summary statistics are n=500, x= 6.83 km, s = 4.65 km. Use a 0.01 significance level to test the claim of a seismologist that these earthquakes are from a population with a mean equal to 6.00. Assume that a simple random sample has been selected. Identify the null and alternative hypotheses, test statistic, P-value, and state the final conclusion that addresses the original claim. What are the null and alternative hypotheses? O A....
A data set lists earthquake depths. The summary statistics are n= 400, x= 5.46 km, s...
 A data set lists earthquake depths. The summary statistics are n= 400, x= 5.46 km, s = 4.68 km. Use a 0.01 significance level to test the claim of a seismologist that these earthquakes are from a population with a mean equal to 5.00. Assume that a simple random sample has been selected. Identify the null and alternative hypotheses, test statistic, P-value, and state the final conclusion that addresses the original claim.
A data set lists earthquake depths. The summary statistics are nequals600, x overbarequals4.37 km, sequals4.65 km....
A data set lists earthquake depths. The summary statistics are nequals600, x overbarequals4.37 km, sequals4.65 km. Use a 0.01 significance level to test the claim of a seismologist that these earthquakes are from a population with a mean equal to 4.00. Assume that a simple random sample has been selected. Identify the null and alternative hypotheses, test statistic, P-value, and state the final conclusion that addresses the original claim. What are the null and alternative hypotheses? A. Upper H 0:...
A data set lists earthquake depths. The summary statistics are n=600, x overbarequals5.36 km, s=4.59 km....
A data set lists earthquake depths. The summary statistics are n=600, x overbarequals5.36 km, s=4.59 km. Use a 0.01 significance level to test the claim of a seismologist that these earthquakes are from a population with a mean equal to 5.00. Assume that a simple random sample has been selected. Identify the null and alternative hypotheses, test statistic, P-value, and state the final conclusion that addresses the original claim.
mean equal to 6.00. Assume that a simpl A data set lists earthquake depths. The summary...
 mean equal to 6.00. Assume that a simpl A data set lists earthquake depths. The summary statistics are n=400, = 6.41 km, s = 4.18 km. Use a 0.01 significance level to test the claim of a seismologist that these earthquakes are from a population with random sample has been selected. Identify the null and alternative hypotheses, test statistic, P-value, and state the final conclusion that addresses the original claim. What are the null and alternative hypotheses? O A. Hop*6.00...
A data set lists earthquake depths. The summary statistics are n=500, x=6.86 km, s=4.76 km. Use...
A data set lists earthquake depths. The summary statistics are n=500, x=6.86 km, s=4.76 km. Use a 0.01 significance level to test the claim of a seismologist that these earthquakes are from a population with a mean equal to 6.00. Assume that a simple random sample has been selected. Identify the null and alternative hypotheses, test statistic, P-value, and state the final conclusion that addresses the original claim. What are the null and alternative hypotheses? A. H0: μ=6.00 km H1:...
A data set lists earthquake depths. The summary statistics are n=600, x̅=6.68 km, s=4.55 km
 A data set lists earthquake depths. The summary statistics are n=600, x̅=6.68 km, s=4.55 km. Use a 0.01 significance level to test the claim of a seismologist that these earthquakes are from a population with a mean equal to 6.00. Assume that a simple random sample has been selected. Identify the null and alternative hypotheses, test statistic, P-value, and state the final conclusion that addresses the original claim.
A data set lists earthquake depths. The summary statistics are n =500 , x =6.78km, s=...
A data set lists earthquake depths. The summary statistics are n =500 , x =6.78km, s= 4.41 km. Use a 0.01 significance level to test the claim of a seismologist that these earthquakes are from a population with a mean equal to 6.00. Assume that a simple random sample has been selected. Identify the null and alternative hypotheses, test statistic, P-value, and state the final conclusion that addresses the original claim. What are the null and alternative hypotheses? A. H0...
A data set lists earthquake depths. The summary statistics we n = 400, 442 km 4.11...
 A data set lists earthquake depths. The summary statistics we n = 400, 442 km 4.11 U 001 nice level to the dam of a seismologist that these earthquakes from a population when Assum random sample has been selected Identity the nuild itemslive hypotheses, statistical and state the final conclusion that addresses the onginaciam What are the null and tomative hypotheses? O A HO 400 km OB 400km H < 400 km H 400 OCH 400 km H 400 m...
 A data set lists earthquake depths. The summary statistics are n 400, x=4.46 km, s=4.43 km. Use a 0.01 significance level to test the claim of a seismologist that these earthquakes are from a population with a mean equal to 4.00. Assume that a simple random sample has been selected. Identify the nul and alternative hypotheses, test statistic, P-value, and state the final conclusion that addresses the original claim. What are the null and alternative hypotheses? O A. Ho:u=4.00 km...
 A data set lists earthquake depths. The summary statistics are n=500, x= 6.83 km, s = 4.65 km. Use a 0.01 significance level to test the claim of a seismologist that these earthquakes are from a population with a mean equal to 6.00. Assume that a simple random sample has been selected. Identify the null and alternative hypotheses, test statistic, P-value, and state the final conclusion that addresses the original claim. What are the null and alternative hypotheses? O A....
 A data set lists earthquake depths. The summary statistics are n= 400, x= 5.46 km, s = 4.68 km. Use a 0.01 significance level to test the claim of a seismologist that these earthquakes are from a population with a mean equal to 5.00. Assume that a simple random sample has been selected. Identify the null and alternative hypotheses, test statistic, P-value, and state the final conclusion that addresses the original claim.
 mean equal to 6.00. Assume that a simpl A data set lists earthquake depths. The summary statistics are n=400, = 6.41 km, s = 4.18 km. Use a 0.01 significance level to test the claim of a seismologist that these earthquakes are from a population with random sample has been selected. Identify the null and alternative hypotheses, test statistic, P-value, and state the final conclusion that addresses the original claim. What are the null and alternative hypotheses? O A. Hop*6.00...
 A data set lists earthquake depths. The summary statistics are n=600, x̅=6.68 km, s=4.55 km. Use a 0.01 significance level to test the claim of a seismologist that these earthquakes are from a population with a mean equal to 6.00. Assume that a simple random sample has been selected. Identify the null and alternative hypotheses, test statistic, P-value, and state the final conclusion that addresses the original claim.
 A data set lists earthquake depths. The summary statistics we n = 400, 442 km 4.11 U 001 nice level to the dam of a seismologist that these earthquakes from a population when Assum random sample has been selected Identity the nuild itemslive hypotheses, statistical and state the final conclusion that addresses the onginaciam What are the null and tomative hypotheses? O A HO 400 km OB 400km H < 400 km H 400 OCH 400 km H 400 m...
Most questions answered within 3 hours.
-
Le Terroir Winery is considering an expansion project to produce
fine wines. The trial expansion will...
asked 2 minutes ago -
The Bahraini public budget experiences deficit in the last
seven years, what are procedures are taken...
asked 9 minutes ago -
You invested $30,000 in a mutual fund at the beginning of the
year when the NAV...
asked 13 minutes ago -
Would you expect the price elasticity of supply for guitars to
be more inelastic in the...
asked 15 minutes ago -
A snowmobile is originally at the point with position vector
30.1 m at 95.0° counterclockwise from...
asked 15 minutes ago -
MAN3240 Organizational Behavior
In one to two paragraphs
6.) How can understanding emotions make me more...
asked 23 minutes ago -
Identify one individual who, in your opinion, is an excellent
leader. List the qualities that this...
asked 20 minutes ago -
For the data set shown below, complete parts (a) through (d)
below. x 3 4 5...
asked 26 minutes ago -
A university administrator working in student housing wants to
determine if the percentage of students residing...
asked 40 minutes ago -
3). Describe human population growth that has occurred in the
past 400 years. Use terms learned...
asked 37 minutes ago -
A
projectile is blue at a target. The distance from the point of
impact to the...
asked 1 hour ago -
Given a 32 bit processor, with 2 MB of physical RAM split into 512
frames. What...
asked 52 minutes ago