
Homework Answers
Add Answer to:
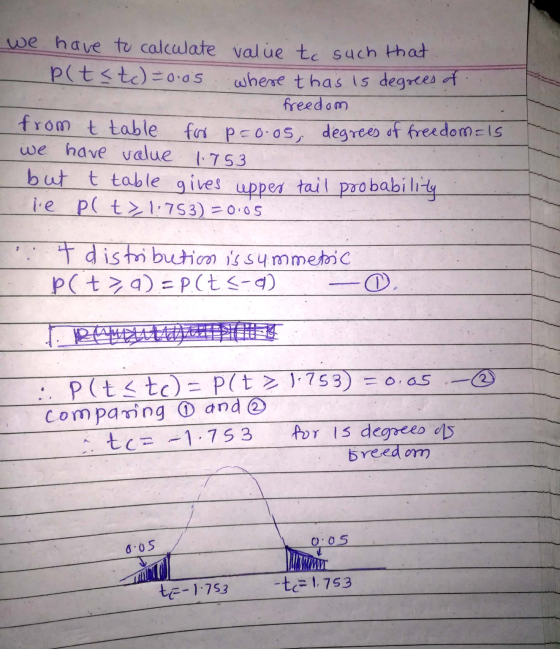
Consider the value of t such that 0.05 of the area under the curve is to...
A polymer mixing process must be run until the blending is complete. A random sample of...
 A polymer mixing process must be run until the blending is complete. A random sample of nine runs measuring the time to complete blending, were recorded as in hours 13.96, 14.68, 11.54, 12.32,15.24. 14.16, 13.5, 13.74, 11.54 Assuming blending times are normally distributed but sample size is too SMALL to assumes , construct a 99% confidence interval for the true mean blending time. t-values for tail area a v 0.100 0.050 0.025 0.010 0.005 1 3.078 6.314 12.706 31.821 63.657...
19 Find the critical value t for the confidence level c= 0.90 and sample size n=7....
 19
Find the critical value t for the confidence level c= 0.90 and sample size n=7. Click the icon to view the t-distribution table. 11 to (Round to the nearest thousandth as needed.) ters 5, 6, & 7 Time Ren 19 of 32 (24 complete) i t-Distribution Table - X Level of confidence, One tail, a Two tails, a d.f. d.r. 1 1 2 3 4 5 0.80 0.10 0.20 3.078 1.886 1.638 1.533 1.476 1.440 1.415 1.397 1.383 1372...
19
Find the critical value t for the confidence level c= 0.90 and sample size n=7. Click the icon to view the t-distribution table. 11 to (Round to the nearest thousandth as needed.) ters 5, 6, & 7 Time Ren 19 of 32 (24 complete) i t-Distribution Table - X Level of confidence, One tail, a Two tails, a d.f. d.r. 1 1 2 3 4 5 0.80 0.10 0.20 3.078 1.886 1.638 1.533 1.476 1.440 1.415 1.397 1.383 1372...
Question 11 (1 mark) Attempt 2 A polymer mixing process must be run until the blending...
 Question 11 (1 mark) Attempt 2 A polymer mixing process must be run until the blending is complete. A random sample of nine runs measuring the time to complete blending, were recorded as (in hours): 13.7, 14.72, 11.6, 14.22, 12.5, 14.5, 13.04, 15.06, 13.32. Assuming blending times are normally distributed but sample size is too SMALL to assume so, construct a 95% confidence interval for the true mean blending time. t-values for tail area a v 0.100 0.050 0.025 0.010...
Determine the t-value in each of the cases. Click the icon to view the table of...
 Determine the t-value in each of the cases. Click the icon to view the table of areas under the t-distribution. (a) Find the t-value such that the area in the right tail is 0.05 with 27 degrees of freedom. (Round to three decimal places as needed.) (b) Find the t-value such that the area in the right tail is 0.25 with 17 degrees of freedom. (Round to three decimal places as needed.) (c) Find the t-value such that the area...
Determine the t-value in each of the cases. Click the icon to view the table of...
 Determine the t-value in each of the cases. Click the icon to view the table of areas under the t-distribution. (a) Find the t-value such that the area in the right tail is 0.15 with 30 degrees of freedom. (Round to three decimal places as needed.) (b) Find the t-value such that the area in the right tail is 0.025 with 16 degrees of freedom. (Round to three decimal places as needed.) (c) Find the t-value such that the area...
Find the critical value(s) and rejection region(s) for the indicated t-test, level of significance a, and...
 Find the critical value(s) and rejection region(s) for the indicated t-test, level of significance a, and sample size n. Two-tailed test, a = 0.02, n=28 Click the icon to view the t-distribution table. The critical value(s) is/are (Round to the nearest thousandth as needed. Use a comma to separate answers as needed.) Determine the rejection region(s). Select the correct choice below and fill in the answer box(es) within your choice. (Round to the nearest thousandth as needed.) OB. << O...
Bike lanes were implemented to reduce the number of a Long Beach. To test the effectiveness of this measure the following city-wide accident used: 4) ccidents on certain locations in the City of d...
 Bike lanes were implemented to reduce the number of a Long Beach. To test the effectiveness of this measure the following city-wide accident used: 4) ccidents on certain locations in the City of data were Before implementation 30 32 30 31.0 1.15 After implementation 28 27 25 26.7 1.53 Year 1 Year 2 Year 3 Mean Stadard Deviation Use the t-test to determine the effectiveness of bike lanes at 5% level of significance. State the null and alternative hypotheses, and...
Find the margin of error for the given values of c, s, and n. t-Distribution Table...
 Find the margin of error for the given values of c, s, and n. t-Distribution Table c=0.95, s =3.6, n = 21 Click the icon to view the t-distribution table. The margin of error is (Round to one decimal place as needed.) Level of confidence, C One tail, a Two tails, a d.f. 1 2 3 4 5 6 0.50 0.25 0.50 1.000 .816 765 741 727 .718 .711 706 703 .700 .697 .695 .694 .692 .691 7 8 0.80...
6.2.5 t-Distribution Table Find the margin of error for the given values of c, s, and...
 6.2.5 t-Distribution Table Find the margin of error for the given values of c, s, and n. c=0.98, s=4, n=11 Click the icon to view the t-distribution table. Level of confidence, One tailo Two tails, d.r. d.t. The margin of error is (Round to one decimal place as needed.) 0.99 0.005 0.01 63657 9.925 5.841 1 2 3 3 4 4.604 0.80 0.10 0.20 3.078 1.885 1.638 1.533 1.476 1.440 1.415 1.397 1.383 1372 1.363 1.356 1.350 5 6 0.90...
Using a table of critical t-values of the t distribution, find the range of values for...
 Using a table of critical t-values of the t distribution, find
the range of values for the P-value for testing a claim about the
mean body temperature of healthy adults for a left-tailed test
with n=12 and test statistic t= -2.475
What is the range of values for the P-value?
A. 0.01 <P-value< 0.025
B. 0.025<P-value<0.05
C. P-value<0.005
D. 0.005 <P-value<0.01
x t-table t distribution: Critical t values 0.005 0.01 Area in One Tail 0.025 0.05 0.10 Degrees of Freedom...
Using a table of critical t-values of the t distribution, find
the range of values for the P-value for testing a claim about the
mean body temperature of healthy adults for a left-tailed test
with n=12 and test statistic t= -2.475
What is the range of values for the P-value?
A. 0.01 <P-value< 0.025
B. 0.025<P-value<0.05
C. P-value<0.005
D. 0.005 <P-value<0.01
x t-table t distribution: Critical t values 0.005 0.01 Area in One Tail 0.025 0.05 0.10 Degrees of Freedom...
 A polymer mixing process must be run until the blending is complete. A random sample of nine runs measuring the time to complete blending, were recorded as in hours 13.96, 14.68, 11.54, 12.32,15.24. 14.16, 13.5, 13.74, 11.54 Assuming blending times are normally distributed but sample size is too SMALL to assumes , construct a 99% confidence interval for the true mean blending time. t-values for tail area a v 0.100 0.050 0.025 0.010 0.005 1 3.078 6.314 12.706 31.821 63.657...
 19
Find the critical value t for the confidence level c= 0.90 and sample size n=7. Click the icon to view the t-distribution table. 11 to (Round to the nearest thousandth as needed.) ters 5, 6, & 7 Time Ren 19 of 32 (24 complete) i t-Distribution Table - X Level of confidence, One tail, a Two tails, a d.f. d.r. 1 1 2 3 4 5 0.80 0.10 0.20 3.078 1.886 1.638 1.533 1.476 1.440 1.415 1.397 1.383 1372...
19
Find the critical value t for the confidence level c= 0.90 and sample size n=7. Click the icon to view the t-distribution table. 11 to (Round to the nearest thousandth as needed.) ters 5, 6, & 7 Time Ren 19 of 32 (24 complete) i t-Distribution Table - X Level of confidence, One tail, a Two tails, a d.f. d.r. 1 1 2 3 4 5 0.80 0.10 0.20 3.078 1.886 1.638 1.533 1.476 1.440 1.415 1.397 1.383 1372...
 Question 11 (1 mark) Attempt 2 A polymer mixing process must be run until the blending is complete. A random sample of nine runs measuring the time to complete blending, were recorded as (in hours): 13.7, 14.72, 11.6, 14.22, 12.5, 14.5, 13.04, 15.06, 13.32. Assuming blending times are normally distributed but sample size is too SMALL to assume so, construct a 95% confidence interval for the true mean blending time. t-values for tail area a v 0.100 0.050 0.025 0.010...
 Determine the t-value in each of the cases. Click the icon to view the table of areas under the t-distribution. (a) Find the t-value such that the area in the right tail is 0.05 with 27 degrees of freedom. (Round to three decimal places as needed.) (b) Find the t-value such that the area in the right tail is 0.25 with 17 degrees of freedom. (Round to three decimal places as needed.) (c) Find the t-value such that the area...
 Determine the t-value in each of the cases. Click the icon to view the table of areas under the t-distribution. (a) Find the t-value such that the area in the right tail is 0.15 with 30 degrees of freedom. (Round to three decimal places as needed.) (b) Find the t-value such that the area in the right tail is 0.025 with 16 degrees of freedom. (Round to three decimal places as needed.) (c) Find the t-value such that the area...
 Find the critical value(s) and rejection region(s) for the indicated t-test, level of significance a, and sample size n. Two-tailed test, a = 0.02, n=28 Click the icon to view the t-distribution table. The critical value(s) is/are (Round to the nearest thousandth as needed. Use a comma to separate answers as needed.) Determine the rejection region(s). Select the correct choice below and fill in the answer box(es) within your choice. (Round to the nearest thousandth as needed.) OB. << O...
 Bike lanes were implemented to reduce the number of a Long Beach. To test the effectiveness of this measure the following city-wide accident used: 4) ccidents on certain locations in the City of data were Before implementation 30 32 30 31.0 1.15 After implementation 28 27 25 26.7 1.53 Year 1 Year 2 Year 3 Mean Stadard Deviation Use the t-test to determine the effectiveness of bike lanes at 5% level of significance. State the null and alternative hypotheses, and...
 Find the margin of error for the given values of c, s, and n. t-Distribution Table c=0.95, s =3.6, n = 21 Click the icon to view the t-distribution table. The margin of error is (Round to one decimal place as needed.) Level of confidence, C One tail, a Two tails, a d.f. 1 2 3 4 5 6 0.50 0.25 0.50 1.000 .816 765 741 727 .718 .711 706 703 .700 .697 .695 .694 .692 .691 7 8 0.80...
 6.2.5 t-Distribution Table Find the margin of error for the given values of c, s, and n. c=0.98, s=4, n=11 Click the icon to view the t-distribution table. Level of confidence, One tailo Two tails, d.r. d.t. The margin of error is (Round to one decimal place as needed.) 0.99 0.005 0.01 63657 9.925 5.841 1 2 3 3 4 4.604 0.80 0.10 0.20 3.078 1.885 1.638 1.533 1.476 1.440 1.415 1.397 1.383 1372 1.363 1.356 1.350 5 6 0.90...
 Using a table of critical t-values of the t distribution, find
the range of values for the P-value for testing a claim about the
mean body temperature of healthy adults for a left-tailed test
with n=12 and test statistic t= -2.475
What is the range of values for the P-value?
A. 0.01 <P-value< 0.025
B. 0.025<P-value<0.05
C. P-value<0.005
D. 0.005 <P-value<0.01
x t-table t distribution: Critical t values 0.005 0.01 Area in One Tail 0.025 0.05 0.10 Degrees of Freedom...
Using a table of critical t-values of the t distribution, find
the range of values for the P-value for testing a claim about the
mean body temperature of healthy adults for a left-tailed test
with n=12 and test statistic t= -2.475
What is the range of values for the P-value?
A. 0.01 <P-value< 0.025
B. 0.025<P-value<0.05
C. P-value<0.005
D. 0.005 <P-value<0.01
x t-table t distribution: Critical t values 0.005 0.01 Area in One Tail 0.025 0.05 0.10 Degrees of Freedom...
Most questions answered within 3 hours.
-
A sine wave signal is displayed on the screen of an
oscilloscope. 6 peak-to-peak divisions are...
asked 57 seconds ago -
a
1500 kg car accelerates from 0 to 25 m / s in 21.0s. How much...
asked 1 hour ago -
Calculate the molarity of each of the following solutions:
(a) 30.5 g of ethanol (C2H5OH) in...
asked 1 hour ago -
1 Refer to the build-borrow-or-buy framework as a decision tree
for the Adidas company. Identify a...
asked 1 hour ago -
Problem 2: The Problem of Social Cost. A Rancher and Farmer live
side-by-side to each other....
asked 2 hours ago -
a uniform bar of weight 40N is 4 meter long. weights
on 60N and 100N are...
asked 2 hours ago -
Define Diet counceling? What are the
responsibilities of a counselor?
asked 4 hours ago -
Hey im just confused about how to put the ' A angle n' and ' S...
asked 4 hours ago -
A short essay about the WSJ article on Oreo versus Hydrox.
asked 4 hours ago -
##8. A program contains the following function definition:
##def cube(num):
##return num * num * num...
asked 4 hours ago -
find the value z of a standard Normal variable that satisfies
each of the given conditions....
asked 4 hours ago -
"banana".find('z')
Out[22]: -1
why is this -1
python 3.7
asked 4 hours ago