A kindergarten teacher is interested in investigating differences in the amount of time students spend reading...
A kindergarten teacher is interested in investigating differences in the amount of time students spend reading for 20 min. free-time period based on the average number of days per week parents reports reading to their children. Children were assigned to groups based on Low Parental Reading (1-2 days per week), Medium Parental Reading (3-4 days per week), or Frequent Parental Reading (5-7 days per week).
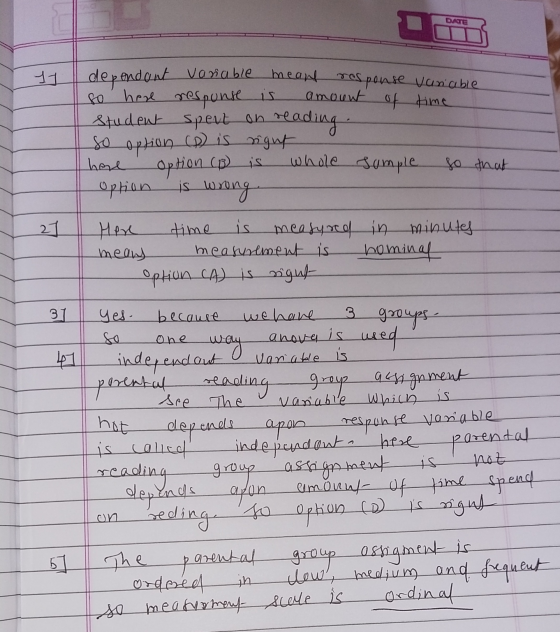
1. What is the dependent variable in the study?
| A. |
Parental reading group assignment - low, medium, frequent. |
|
| B. |
Kindergarten students |
|
| C. |
Parental report of reading time. |
|
| D. |
Amount of time students spend reading during 20 min. of free time. |
2. What is measurement scale is the dependent variable in the study?
| A. |
nominal |
|
| B. |
ordinal |
|
| C. |
interval/ratio |
3. Is the measurement scale of the dependent variable appropriate for using an independent samples one-way ANOVA?
Yes or No?
4. What is the independent variable in the study?
| A. |
Parental report of reading time. |
|
| B. |
Kindergarten students |
|
| C. |
Amount of time students spend reading during 20 min. of free time. |
|
| D. |
Parental reading group assignment - low, medium, frequent. |
5. What is the measurement scale of the independent variable in the study?
| A. |
nominal |
|
| B. |
ordinal |
|
| C. |
interval/ratio |
Homework Answers
Add Answer to:
A kindergarten teacher is interested in investigating
differences in the amount of time students spend reading...
If a study was done that asked college students exactly how many A’s they have obtained...
If a study was done that asked college students exactly how many A’s they have obtained (e.g., 0, 1, 2, etc.), the researcher is using: A nominal measure An ordinal measure An interval measure A ratio measure Provide an example of each of these two scales (ordinal and interval/ratio) that represent students’ performance in a statistics course. You found that a zero is included in a scale of a measurement. Which of the following is correct about the measurement scale?...
School district officials believe that students spend plenty of time reading at home. A teacher wants...
School district officials believe that students spend plenty of time reading at home. A teacher wants to convince these officials that, on average, students spend less than 90 minutes per week reading at home. What is the alternative hypothesis? a. Ha: p < 0.90 b. Ha: p > 0.90 c. Ha: > 90 d. Ha: < 90
QUESTION 3 A teacher wishes to study the amount of time students in his statistics course spend each week in study for...
 QUESTION 3 A teacher wishes to study the amount of time students in his statistics course spend each week in study for the course. He nominal 6 hours (two hours outside class for every hour in class). So he has the students keep track of and report the time spent in study during a typical week. A total of 7 students respond. The average time spent is 6.5 hours with a standard deviation of 2 hours. With this information he...
0 pts A large Midwestern university is interested in estimating the mean time that students spend...
0 pts A large Midwestern university is interested in estimating the mean time that students spend at the student recreation center per week. A previous study indicated that the standard deviation in time is about 25 minutes per week. If the officials wish to estimate the mean time within ± 4 minutes with a 90 percent confidence, what should the sample size be? 106 Can't be determined without the sample mean. 105 105.685
el believes that kids who spend less time indoors will have better interpersonal , studies a...
 el believes that kids who spend less time indoors will have better interpersonal , studies a sample of 20 kids in a third-grade class at his former primary school. He asks e auch time he or she spends indoors in a week (measured in hours) and also how many frie has. Daniel looks to see if there is a relationship between time spent indoors and numbe s kids have. ter 1 homework ) Is this study an experiment or an...
Question 8: Only an experiment can demonstrate cause-and-effect relationships between variables. Question 8 options: A)...
Question 8: Only an experiment can demonstrate cause-and-effect relationships between variables. Question 8 options: A) True B) False Question 9 Saved A researcher observes the number of tasks completed by male and female participants during a multitasking observation period. In this example, sex (male, female) is the quasi-independent variable. Question 9 options: A) True B) False Question 10 Children are randomly assigned to complete a low, moderate, or high difficulty task. The time (in seconds) it takes them to complete...
A graduate student believed that, on the average, college students spend more time on the Internet...
A graduate student believed that, on the average, college students spend more time on the Internet compared to the rest of the population. She conducted a study to determine if her hypothesis was correct. The student randomly surveyed 25 students and found that the average amount of time spent on the Internet was 8.75 hours per week with a SD = 3 hours. The last census found that, on the average, people spent 11 hour per week on the Internet....
A researcher is interested in determining if a new intensive treatment program for high school students...
A researcher is interested in determining if a new intensive treatment program for high school students with alcohol abuse problems is effective. In order to recruit participants for this study, flyers are mailed to all families of high school students in the Northwest Arkansas area. Ninetythree families decide to participate in the study. To test the main research hypothesis, the families are randomly assigned to one of three groups, with the restriction that an equal number of families are in...
What is the relationship between the amount of time statistics students study per week and their...
What is the relationship between the amount of time statistics students study per week and their test scores? The results of the survey are shown below. Time 16 14 15 6 14 15 6 Score 100 89 100 68 99 100 78 x-values y-values Find the correlation coefficient: r=r= Round to 2 decimal places. The null and alternative hypotheses for correlation are: H0:H0: ? ρ r μ == 0 H1:H1: ? μ r ρ ≠≠ 0 The p-value is: (Round to four decimal...
What is the relationship between the amount of time statistics students study per week and their...
 What is the relationship between the amount of time statistics students study per week and their final exam scores? The results of the survey are shown below. Time Score 3 67 13 95 6 15 77 89 13 100 3 66 7 63 11 79 1 59 a. Find the correlation coefficient: r = Round to 2 decimal places. b. The null and alternative hypotheses for correlation are: Ho: ? D = 0 H: ? *0 The p-value is: (Round...
 QUESTION 3 A teacher wishes to study the amount of time students in his statistics course spend each week in study for the course. He nominal 6 hours (two hours outside class for every hour in class). So he has the students keep track of and report the time spent in study during a typical week. A total of 7 students respond. The average time spent is 6.5 hours with a standard deviation of 2 hours. With this information he...
 el believes that kids who spend less time indoors will have better interpersonal , studies a sample of 20 kids in a third-grade class at his former primary school. He asks e auch time he or she spends indoors in a week (measured in hours) and also how many frie has. Daniel looks to see if there is a relationship between time spent indoors and numbe s kids have. ter 1 homework ) Is this study an experiment or an...
 What is the relationship between the amount of time statistics students study per week and their final exam scores? The results of the survey are shown below. Time Score 3 67 13 95 6 15 77 89 13 100 3 66 7 63 11 79 1 59 a. Find the correlation coefficient: r = Round to 2 decimal places. b. The null and alternative hypotheses for correlation are: Ho: ? D = 0 H: ? *0 The p-value is: (Round...
Most questions answered within 3 hours.
-
2) You are given the task of finding a representation for a
circle in a drawing...
asked 40 seconds ago -
1. An object weighing 40 N rests on a surface. The coefficient
of friction is 0.35....
asked 1 hour ago -
Investor company owns 35% of investee company voting stock and
accounts for the investment under the...
asked 2 hours ago -
The number of major faults on a randomly chosen 1 km stretch of
highway has a...
asked 2 hours ago -
Consider the competitive environment of Starbuck's, Progressive
Insurance, a manufacturing firm with low turnover, or a...
asked 3 hours ago -
3. Gains from trade
Consider two neighbouring island countries called Euphoria and
Contente. They each have...
asked 5 hours ago -
A business executive has the option to invest money in two
plans: Plan A guarantees that...
asked 7 hours ago -
Hello, can someone please help me answer this question?
How much heat is absorbed by a...
asked 7 hours ago -
. A marketing researcher conducted a survey of 25 shoppers
randomly selected at the local mall...
asked 7 hours ago -
Create an comprehensive response to the
following:
Antimicrobial agents work on a multitude of microbes (bacteria,...
asked 7 hours ago -
6.13 LAB: Step counter. Section 6.3.
A pedometer treats walking 2,000 steps as walking 1 mile....
asked 7 hours ago -
(14.2) A block of mass m = 10 kg riding on a frictionless
horizontal plane is...
asked 7 hours ago