
 NEED SOLUTION FOR THIS PROJECT
STEP BY STEP WITH DETAILS. AS EARLY AS POSSIBLE.
NEED SOLUTION FOR THIS PROJECT
STEP BY STEP WITH DETAILS. AS EARLY AS POSSIBLE.
Homework Answers
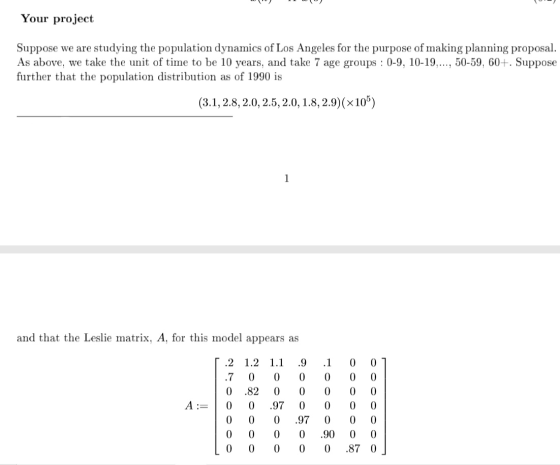
Part One
The numbers below the diagonal say how many people survived from
one group to another. For example  of the people which was in the interval
  in one previous census is
  of the current census.
The elements in the first row indicate how many children did a
group have (i.e. birth rate) in a period of  years. For example, people in
had approximately
years. For example, people in
had approximately  children each.
Factors that can change this data are:
Social: If people receive more sexual education they may have less
children in the period
.
Economic: A better economy provides better conditions for living,
then more children.
Part Two
Since time zero is 1990, we need to calculate  ,
,  ,
,  and
and  for the population of 2000, 2010, 2020 and 2030 respectively. We
have that the populations
for the population of 2000, 2010, 2020 and 2030 respectively. We
have that the populations  are
are

The total population is the sum of the vector components for each decade. We get,

These are the fractions of how much did the population changed each decade,

The maximum eigenvalue of  is
is  . Population change fraction seems to converge to the value
.
. Population change fraction seems to converge to the value
.
Part Three
According to this model, the population will increase indefinitely. That is, the population is unstable. The problem is that we are not having into consideration external factors, such as limited resources. In population 24, the two populations are approximately a multiple of the previous one:

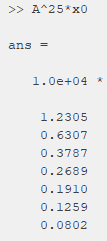
The constant is
, the largest eigenvalue of
.
Part Four
The new birth rate of the second group is  . So, the new matrix
is
. So, the new matrix
is

These are the new values for the population

with a total of
 .
.
The population is still unstable since people in group three are having more than one children each generation.
Add Answer to:
NEED SOLUTION FOR THIS PROJECT
STEP BY STEP WITH DETAILS. AS EARLY AS POSSIBLE.
Linear Algebra...
Linear Algebra Project : Urban Population Dynamics This project is about population modeling and how linear...
 Linear Algebra Project : Urban Population Dynamics This project is about population modeling and how linear algebra tools may be used to study it. Population modeling is useful from different perpectives: 1, planners at the city, state, and national level who look at human populations and need forecasts of populations in order to do planning for future needs. These future needs include housing, schools, care for elderly, jobs, and utilities such as electricity, water and transportation. 2. businesses do population...
Thanks ahead of time!!! Problem 2: Modeling inseet population dynamies The use of arrays and matrix...
 Thanks ahead of time!!!
Problem 2: Modeling inseet population dynamies The use of arrays and matrix algebra are ideal for modeling population dynamics of organisms. If n) is computed from represents the number of organisms at time t, then the number at a later time, t+1, can be n(t+1) An(t). The array (vector, n) consists of the nurnber of females in each age class, and the array (matrix, A), called a Leslie matrix, is the survival- replacement matrix. Multiplying the...
Thanks ahead of time!!!
Problem 2: Modeling inseet population dynamies The use of arrays and matrix algebra are ideal for modeling population dynamics of organisms. If n) is computed from represents the number of organisms at time t, then the number at a later time, t+1, can be n(t+1) An(t). The array (vector, n) consists of the nurnber of females in each age class, and the array (matrix, A), called a Leslie matrix, is the survival- replacement matrix. Multiplying the...
Ecology questions for final exam (Practice). Just the answers for now are fine but will ask...
 Ecology questions for final exam (Practice). Just the answers
for now are fine but will ask questions depending on the answer.
THANK YOU. Covid-19 has made learning difficult.
16. Competition has a negative effect on the individual's fitness via its negative effect on survival, growth, fecundity a. True b. False 90-94 Age 25-29 Questions 17 - 21 are based on the graph to the right. This graph describes the age structure of a population 100+ 95-99 17. The fraction of...
Ecology questions for final exam (Practice). Just the answers
for now are fine but will ask questions depending on the answer.
THANK YOU. Covid-19 has made learning difficult.
16. Competition has a negative effect on the individual's fitness via its negative effect on survival, growth, fecundity a. True b. False 90-94 Age 25-29 Questions 17 - 21 are based on the graph to the right. This graph describes the age structure of a population 100+ 95-99 17. The fraction of...
Linear Algebra The question is actually on the third picture, i’m not sure if the information...
 Linear Algebra
The question is actually on the third picture, i’m not sure if
the information on picture 1 and 2 is supposed to help with the
problem.
Please complete Q9. You may need information from Q7.
Please clearly label a b. Total 2 questions. Please complete Q
9.
Some problems in genetics can be solved using Markov chains. For example, if we know the genotype distribution of the present generation, call it xo, we can use the transition matrix...
Linear Algebra
The question is actually on the third picture, i’m not sure if
the information on picture 1 and 2 is supposed to help with the
problem.
Please complete Q9. You may need information from Q7.
Please clearly label a b. Total 2 questions. Please complete Q
9.
Some problems in genetics can be solved using Markov chains. For example, if we know the genotype distribution of the present generation, call it xo, we can use the transition matrix...
Question 9 Below is the time phased baseline budget for a project and a table showing...
 Question 9 Below is the time phased baseline budget for a project and a table showing the progress as of End of Period 7. 2 Baseline PV Total Task Time Period PV 0 1 3 5 6 7 8 10 11 A 30 15 15 40 20 20 с 80 10 10 10 10 20 20 D 30 5 5 5 5 10 E 20 5 5 5 5 F 40 10 20 5 5 10 5 5 PV by...
Statistics Problem: You have been asked to engage in one final project for the political organization...
Statistics Problem: You have been asked to engage in one final project for the political organization for which you have been working. This time you wish to study the nature of the relationship between the ages of the donors to the campaign and the amount of money they plan to donate or have donated. Data is collected from a random sample of supporters of the candidate. This data is shown on the next page. Various questions need to be answered...
Part 1 In 1950 the U.S. had a population of 150 million and it was growing at 1.3% a year. Assume no net migration. (10...
 Part 1 In 1950 the U.S. had a population of 150 million and it was growing at 1.3% a year. Assume no net migration. (10 points total) a. In about how many years will it take for the U.S. population to double? (5 points) b. In 2010 U.S. population was 308 million. Calculate the average annual growth rate of the population over these 60 years. (5 points) Part 2 In year 1, a country has a population of 100 people;...
Here is the data analysis project, please I need an excellent project, it is due 4 hours! Statist...
here is the data analysis project, please I need an excellent project, it is due 4 hours! Statistics course. GENERAL DESCRIPTION For the data analysis project, you address some questions that interest you with the statistical methodology we learn in MAT 235. You choose the question; you decide how to collect data; you do the analyses. The questions can address almost any topic (although I have veto power), including topics in economics, psychology, sociology, natural science, medicine, public policy, sports,...
4. Explo itats, walking step is weighed in a diaper and a t-shirt Need to subtract...
 4. Explo itats, walking step is weighed in a diaper and a t-shirt Need to subtract the weight of the diaper and t-shir order to get correct measurements Cweight) CERTIFICATION PRACTICE Assignment 21-5 Choose the best answer and place the corresponding letter in the blank. 1. Which of the following age classifications would be given to a child who is 21 years old? A. Child B. Infant C. Preschooler D. Toddler 2. Pediatric visual screenings begin at what age? A....
In Python Question 3 (13 points): Purpose: To practice your ability to modify lists and compute...
 In Python
Question 3 (13 points): Purpose: To practice your ability to modify lists and compute with lists of lists Degree of Difficulty: Moderate For this question, you are given some population estimates, by age group, from Statistics Canada for some provinces. Starter File a5q3 starter.py is a file that contains a list of lists, to which the variable Pop-data refers, which represents 2020 population numbers. The first item in Pop_data is a list whose first item is the string...
In Python
Question 3 (13 points): Purpose: To practice your ability to modify lists and compute with lists of lists Degree of Difficulty: Moderate For this question, you are given some population estimates, by age group, from Statistics Canada for some provinces. Starter File a5q3 starter.py is a file that contains a list of lists, to which the variable Pop-data refers, which represents 2020 population numbers. The first item in Pop_data is a list whose first item is the string...
 Linear Algebra Project : Urban Population Dynamics This project is about population modeling and how linear algebra tools may be used to study it. Population modeling is useful from different perpectives: 1, planners at the city, state, and national level who look at human populations and need forecasts of populations in order to do planning for future needs. These future needs include housing, schools, care for elderly, jobs, and utilities such as electricity, water and transportation. 2. businesses do population...
 Thanks ahead of time!!!
Problem 2: Modeling inseet population dynamies The use of arrays and matrix algebra are ideal for modeling population dynamics of organisms. If n) is computed from represents the number of organisms at time t, then the number at a later time, t+1, can be n(t+1) An(t). The array (vector, n) consists of the nurnber of females in each age class, and the array (matrix, A), called a Leslie matrix, is the survival- replacement matrix. Multiplying the...
Thanks ahead of time!!!
Problem 2: Modeling inseet population dynamies The use of arrays and matrix algebra are ideal for modeling population dynamics of organisms. If n) is computed from represents the number of organisms at time t, then the number at a later time, t+1, can be n(t+1) An(t). The array (vector, n) consists of the nurnber of females in each age class, and the array (matrix, A), called a Leslie matrix, is the survival- replacement matrix. Multiplying the...
 Ecology questions for final exam (Practice). Just the answers
for now are fine but will ask questions depending on the answer.
THANK YOU. Covid-19 has made learning difficult.
16. Competition has a negative effect on the individual's fitness via its negative effect on survival, growth, fecundity a. True b. False 90-94 Age 25-29 Questions 17 - 21 are based on the graph to the right. This graph describes the age structure of a population 100+ 95-99 17. The fraction of...
Ecology questions for final exam (Practice). Just the answers
for now are fine but will ask questions depending on the answer.
THANK YOU. Covid-19 has made learning difficult.
16. Competition has a negative effect on the individual's fitness via its negative effect on survival, growth, fecundity a. True b. False 90-94 Age 25-29 Questions 17 - 21 are based on the graph to the right. This graph describes the age structure of a population 100+ 95-99 17. The fraction of...
 Linear Algebra
The question is actually on the third picture, i’m not sure if
the information on picture 1 and 2 is supposed to help with the
problem.
Please complete Q9. You may need information from Q7.
Please clearly label a b. Total 2 questions. Please complete Q
9.
Some problems in genetics can be solved using Markov chains. For example, if we know the genotype distribution of the present generation, call it xo, we can use the transition matrix...
Linear Algebra
The question is actually on the third picture, i’m not sure if
the information on picture 1 and 2 is supposed to help with the
problem.
Please complete Q9. You may need information from Q7.
Please clearly label a b. Total 2 questions. Please complete Q
9.
Some problems in genetics can be solved using Markov chains. For example, if we know the genotype distribution of the present generation, call it xo, we can use the transition matrix...
 Question 9 Below is the time phased baseline budget for a project and a table showing the progress as of End of Period 7. 2 Baseline PV Total Task Time Period PV 0 1 3 5 6 7 8 10 11 A 30 15 15 40 20 20 с 80 10 10 10 10 20 20 D 30 5 5 5 5 10 E 20 5 5 5 5 F 40 10 20 5 5 10 5 5 PV by...
 Part 1 In 1950 the U.S. had a population of 150 million and it was growing at 1.3% a year. Assume no net migration. (10 points total) a. In about how many years will it take for the U.S. population to double? (5 points) b. In 2010 U.S. population was 308 million. Calculate the average annual growth rate of the population over these 60 years. (5 points) Part 2 In year 1, a country has a population of 100 people;...
 4. Explo itats, walking step is weighed in a diaper and a t-shirt Need to subtract the weight of the diaper and t-shir order to get correct measurements Cweight) CERTIFICATION PRACTICE Assignment 21-5 Choose the best answer and place the corresponding letter in the blank. 1. Which of the following age classifications would be given to a child who is 21 years old? A. Child B. Infant C. Preschooler D. Toddler 2. Pediatric visual screenings begin at what age? A....
 In Python
Question 3 (13 points): Purpose: To practice your ability to modify lists and compute with lists of lists Degree of Difficulty: Moderate For this question, you are given some population estimates, by age group, from Statistics Canada for some provinces. Starter File a5q3 starter.py is a file that contains a list of lists, to which the variable Pop-data refers, which represents 2020 population numbers. The first item in Pop_data is a list whose first item is the string...
In Python
Question 3 (13 points): Purpose: To practice your ability to modify lists and compute with lists of lists Degree of Difficulty: Moderate For this question, you are given some population estimates, by age group, from Statistics Canada for some provinces. Starter File a5q3 starter.py is a file that contains a list of lists, to which the variable Pop-data refers, which represents 2020 population numbers. The first item in Pop_data is a list whose first item is the string...
Most questions answered within 3 hours.
-
Use the data in the following table, which lists drive-thru
order accuracy at popular fast food...
asked 17 seconds from now -
assess the potential corporate level strategies for
the organization of Tyson foods
asked 2 minutes ago -
Calculating mean absolute percentage error requires dividing the
forecast error by the actual result for a...
asked 10 minutes ago -
Sparks Corporation has a cash balance of $17,100 on April 1. The
company must maintain a...
asked 9 minutes ago -
A 50-turn coil has a diameter of 15 cm. The coil is placed in a
spatially...
asked 16 minutes ago -
1. How many ATOMS of sulfur
are present in 9.92 grams of sulfur
tetrafluoride, SF4? ____...
asked 18 minutes ago -
A planet orbits a star, in a year of length 4.22 x
107 s, in a...
asked 32 minutes ago -
Briefly explain the concept of market anomalies in Efficient
Market Hypothesis; also provide reasons why they...
asked 35 minutes ago -
True or False: if false correct the statement
The CO2 removed from the atmosphere never returns...
asked 57 minutes ago -
Consider the following balanced chemical equation:
2H2S(g) + SO2(g) →
3S(s) + 2H2O(g)
a. How many...
asked 1 hour ago -
A parallel-plate capacitor has 4.6 cm × 4.6 cm electrodes with
surface charge densities ±1.0×10⁻⁶C/m2. A...
asked 1 hour ago -
Able, Baker, and Charlie are the only three stocks in an index.
The stocks sell for...
asked 1 hour ago