

Homework Answers
a-1)
Here we have to test that
Null hypothesis: 
Alternative hypothesis: 
where 
n = sample size = 24
Sample mean =  = 4.8
= 4.8
Sample standard deviation = s = 0.8
Here population standard deviation is not known so we use t test.
Test statistic:


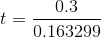
t = 1.837 (Round to 3 decimal)
Test statistic = 1.837
a-2)
Test is right tailed test.
Degrees of freedom = n - 1 = 24 - 1 = 23
Level of significance =  = 0.05
From statistical table of t values,
p value will lie between 0.025 and 0.05
P value = 0.025 < p value  0.05
0.05
a-3)
Here p value
0.05
So we reject H0.
Reject H0 since the p value is not greater than
a-4)
We conclude that the population mean is greater than 4.5.
Add Answer to:
In order to conduct a hypothesis test for the population mean, a random sample of 24...
In order to conduct a hypothesis test for the population mean, a random sample of 24...
 In order to conduct a hypothesis test for the population mean, a random sample of 24 observations is drawn from a normally distributed population. The resulting sample mean and sample standard deviation are calculated as 4.8 and 0.8, respectively. (You may find it useful to reference the appropriate table: z table or t table) H0 : μ s 4 , 5 against HA: μ > 4 . 5 a-1. Calculate the value of the test statistic. (Round all intermediate calculations...
In order to conduct a hypothesis test for the population mean, a random sample of 24...
 In order to conduct a hypothesis test for the population mean, a random sample of 24 observations is drawn from a normally distributed population. The resulting sample mean and sample standard deviation are calculated as 4.8 and 0.8, respectively. (You may find it useful to reference the appropriate table: z table or t table) HOT #3 4.5 against Ha: > 4.5 a-1. Calculate the value of the test statistic. (Round all intermediate calculations to at least 4 decimal places and...
In order to conduct a hypothesis test for the population mean, a random sample of 24...
 In order to conduct a hypothesis test for the population mean, a random sample of 24 observations is drawn from a normally distributed population. The resulting sample mean and sample standard deviation are calculated as 4.8 and 0.8, respectively.(You may find it useful to reference the appropriate table: z table or t table) Hot μ 4.5 against HA: μ > 4.5 a-1. Calculate the value of the test statistic. (Round all intermediate calculations to at least 4 decimal places and...
In order to conduct a hypothesis test for the population mean, a random sample of 24...
In order to conduct a hypothesis test for the population mean, a random sample of 24 observations is drawn from a normally distributed population. The resulting sample mean and sample standard deviation are calculated as 6.3 and 2.5, respectively. (You may find it useful to reference the appropriate table: z table or t table). H0: μ ≤ 5.1 against HA: μ > 5.1 a-1. Calculate the value of the test statistic. (Round all intermediate calculations to at least 4 decimal...
In order to conduct a hypothesis test for the population mean, a random sample of 20...
 In order to conduct a hypothesis test for the population mean, a random sample of 20 observations is drawn from a normally distributed population. The resulting sample mean and sample standard deviation are calculated as 12.9 and 2.4, respectively. (You may find it useful to reference the appropriate table: z table or ttable). Ho : μ 12.1 against HA: μ > 12.1 a-1. Calculate the value of the test statistic. (Round all intermediate calculations to at least 4 decimal places...
In order to conduct a hypothesis test for the population mean, a random sample of 28...
 In order to conduct a hypothesis test for the population mean, a random sample of 28 observations is drawn from a normally distributed population. The resulting sample mean and sample standard deviation are calculated as 17.9 and 1.5, respectively. (You may find it useful to reference the appropriate table: z table or t table) H0 : μ 17.5 against HA: μ > 17.5 a-1. Calculate the value of the test statistic. (Round all intermediate calculations to at least 4 decimal...
In order to conduct a hypothesis test for the population mean, a random sample of 28...
 In order to conduct a hypothesis test for the population mean, a random sample of 28 observations is drawn from a normally distributed population. The resulting sample mean and sample standard deviation are calculated as 17.9 and 1.5, respectively. (You may find it useful to reference the appropriate table: z table or t table). HO: MS 17.5 against HA: > 17.5 a-1. Calculate the value of the test statistic. (Round all intermediate calculations to at least 4 decimal places and...
In order to conduct a hypothesis test for the population proportion, you sample 440 observations that...
 In order to conduct a hypothesis test for the population proportion, you sample 440 observations that result in 220 successes. (You may find it useful to reference the appropriate table: z table or table) He: p > 0.52; HA: p < 0.52. a-1. Calculate the value of the test statistic, (Negative value should be indicated by a minus sign. Round intermediate calculations to at least 4 decimal places and final answer to 2 decimal places.) Test statistic a-2. Find the...
In order to conduct a hypothesis test for the population proportion, you sample 290 observations that...
In order to conduct a hypothesis test for the population proportion, you sample 290 observations that result in 87 successes. (You may find it useful to reference the appropriate table: z table or t table) H0: p ≥ 0.36; HA: p < 0.36. a-1. Calculate the value of the test statistic. (Negative value should be indicated by a minus sign. Round intermediate calculations to at least 4 decimal places and final answer to 2 decimal places.) a-2. Find the p-value....
n order to conduct a hypothesis test for the population proportion, you sample 480 observations that...
 n order to conduct a hypothesis test for the population proportion, you sample 480 observations that result in 264 successes. (You may find it useful to reference the appropriate table: z table or t table) Ho: pz 0.60 HA: p0.60 a-1. Calculate the value of the test statistic. (Negative value should be indicated by a minus sign. Round intermediate calculations to at least 4 decimal places and final answer to 2 decimal places.) Test statistic 2.24 a-2. Find the p-value....
 In order to conduct a hypothesis test for the population mean, a random sample of 24 observations is drawn from a normally distributed population. The resulting sample mean and sample standard deviation are calculated as 4.8 and 0.8, respectively. (You may find it useful to reference the appropriate table: z table or t table) H0 : μ s 4 , 5 against HA: μ > 4 . 5 a-1. Calculate the value of the test statistic. (Round all intermediate calculations...
 In order to conduct a hypothesis test for the population mean, a random sample of 24 observations is drawn from a normally distributed population. The resulting sample mean and sample standard deviation are calculated as 4.8 and 0.8, respectively. (You may find it useful to reference the appropriate table: z table or t table) HOT #3 4.5 against Ha: > 4.5 a-1. Calculate the value of the test statistic. (Round all intermediate calculations to at least 4 decimal places and...
 In order to conduct a hypothesis test for the population mean, a random sample of 24 observations is drawn from a normally distributed population. The resulting sample mean and sample standard deviation are calculated as 4.8 and 0.8, respectively.(You may find it useful to reference the appropriate table: z table or t table) Hot μ 4.5 against HA: μ > 4.5 a-1. Calculate the value of the test statistic. (Round all intermediate calculations to at least 4 decimal places and...
 In order to conduct a hypothesis test for the population mean, a random sample of 20 observations is drawn from a normally distributed population. The resulting sample mean and sample standard deviation are calculated as 12.9 and 2.4, respectively. (You may find it useful to reference the appropriate table: z table or ttable). Ho : μ 12.1 against HA: μ > 12.1 a-1. Calculate the value of the test statistic. (Round all intermediate calculations to at least 4 decimal places...
 In order to conduct a hypothesis test for the population mean, a random sample of 28 observations is drawn from a normally distributed population. The resulting sample mean and sample standard deviation are calculated as 17.9 and 1.5, respectively. (You may find it useful to reference the appropriate table: z table or t table) H0 : μ 17.5 against HA: μ > 17.5 a-1. Calculate the value of the test statistic. (Round all intermediate calculations to at least 4 decimal...
 In order to conduct a hypothesis test for the population mean, a random sample of 28 observations is drawn from a normally distributed population. The resulting sample mean and sample standard deviation are calculated as 17.9 and 1.5, respectively. (You may find it useful to reference the appropriate table: z table or t table). HO: MS 17.5 against HA: > 17.5 a-1. Calculate the value of the test statistic. (Round all intermediate calculations to at least 4 decimal places and...
 In order to conduct a hypothesis test for the population proportion, you sample 440 observations that result in 220 successes. (You may find it useful to reference the appropriate table: z table or table) He: p > 0.52; HA: p < 0.52. a-1. Calculate the value of the test statistic, (Negative value should be indicated by a minus sign. Round intermediate calculations to at least 4 decimal places and final answer to 2 decimal places.) Test statistic a-2. Find the...
 n order to conduct a hypothesis test for the population proportion, you sample 480 observations that result in 264 successes. (You may find it useful to reference the appropriate table: z table or t table) Ho: pz 0.60 HA: p0.60 a-1. Calculate the value of the test statistic. (Negative value should be indicated by a minus sign. Round intermediate calculations to at least 4 decimal places and final answer to 2 decimal places.) Test statistic 2.24 a-2. Find the p-value....
Most questions answered within 3 hours.
-
a
1500 kg car accelerates from 0 to 25 m / s in 21.0s. How much...
asked 33 minutes ago -
Calculate the molarity of each of the following solutions:
(a) 30.5 g of ethanol (C2H5OH) in...
asked 28 minutes ago -
1 Refer to the build-borrow-or-buy framework as a decision tree
for the Adidas company. Identify a...
asked 55 minutes ago -
Problem 2: The Problem of Social Cost. A Rancher and Farmer live
side-by-side to each other....
asked 2 hours ago -
a uniform bar of weight 40N is 4 meter long. weights
on 60N and 100N are...
asked 1 hour ago -
Define Diet counceling? What are the
responsibilities of a counselor?
asked 3 hours ago -
Hey im just confused about how to put the ' A angle n' and ' S...
asked 3 hours ago -
A short essay about the WSJ article on Oreo versus Hydrox.
asked 3 hours ago -
##8. A program contains the following function definition:
##def cube(num):
##return num * num * num...
asked 3 hours ago -
find the value z of a standard Normal variable that satisfies
each of the given conditions....
asked 4 hours ago -
"banana".find('z')
Out[22]: -1
why is this -1
python 3.7
asked 3 hours ago -
Ilegal Consideration Marna Balin was involved in two automobile
accidents in which she suffered severe injures.She...
asked 4 hours ago