


Homework Answers


Add Answer to:
Given in the table are the BMI statistics for random samples of men and women. Assume...
Given in the table are the BMI statistics for random samples of men and women. Assume...
Given in the table are the BMI statistics for random samples of men and women. Assume that the two samples are independent simple random samples selected from normally distributed populations, and do not assume that the population standard deviations are equal. Complete parts (a) and (b) below. Use a 0.01 significance level for both parts. Male BMI Female BMI μ μ1 μ2 n 45 45 x 27.3958 24.7599 s 7.837628 4.750044 a. Test the claim that males and females have...
V2 Given in the table are the BMI statistics for random samples of men and women....
 V2 Given in the table are the BMI statistics for random samples of men and women. Assume that the two samples are independent simple random samples selected from normally distributed populations, and do not assume that the population standard deviations are equal. Complete parts (a) and (b) below. Use a 0.05 significance level for both parts. P1 40 28.4029 7.020534 X 40 24.8792 4.562776 5 OC. Hoy H2 HH1 H2 D. Ho: 11 12 на: 4 #2 The test statistic,...
Given in the table are the BMI statistics for random samples of men and women. Assume...
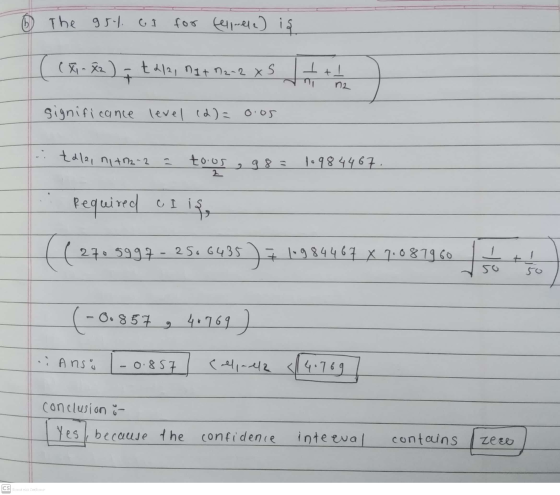
 Given in the table are the BMI statistics for random samples of men and women. Assume that the two samples are independent simple random samples selected from normally distributed populations, and do not assume that the population standard deviations are equal. Use a 0.01 significance level. n Male BMI 1 43 27.7446 7.796304 Female BMI H2 43 25.6933 4.135821 х S Construct a confidence interval suitable for testing the claim that males and females have the same mean BMI. (<47-H...
Stat Ohe sum Save Homework: Ch9 Homework HW Score: 44.51 % , 39.62 of 89 pts...
 Stat Ohe sum Save Homework: Ch9 Homework HW Score: 44.51 % , 39.62 of 89 pts 10 of 16 (11 complete) Score: 3.5 of 7 pts Question Help 9.2.11-T Female BMI Male BMI Given in the table are the BMI statistics for random samples of men and women. Assume that the two samples are independent simple random samples selected from normally distributed populations, and do not assume that the population standard deviations are equal. Complete parts (a) and (b) below....
A. B. 2. The test statistic,is ______ (Round to two decimal places as needed.) 3. The P-value is ______ (Round t...
 A.
B.
2. The test statistic,is ______
(Round to two decimal places as needed.)
3. The P-value is ______
(Round to three decimal places as needed.)
4. State the conclusion for the test.
________________ the null hypothesis. There ______ sufficient
evidence to support the claim that those treated with magnets have
a greater mean reduction in pain than those given a sham
treatment.
5. Is it valid to argue that magnets might appear to be
effective if the sample sizes...
A.
B.
2. The test statistic,is ______
(Round to two decimal places as needed.)
3. The P-value is ______
(Round to three decimal places as needed.)
4. State the conclusion for the test.
________________ the null hypothesis. There ______ sufficient
evidence to support the claim that those treated with magnets have
a greater mean reduction in pain than those given a sham
treatment.
5. Is it valid to argue that magnets might appear to be
effective if the sample sizes...
u A study was done on body temperatures of men and women. The results are shown...
 u A study was done on body temperatures of men and women. The results are shown in the table. Assume that the two samples are independent simple random samples selected from normally distributed populations, and do not assume that the population standard deviations are equal. Complete parts (a) and (b) below. Use a 0.05 significance level for both parts Men 11 11 97.76°F 0.81°F Women 2 59 97.45°F 0.71°F S a. Test the claim that men have a higher mean...
A. B. C. D. Construct a confidence interval suitable for testing claim that students taking non...
 A.
B.
C.
D.
Construct a confidence interval suitable for testing claim that
students taking non proctored tests get higher mean score than
those taking proctored tests.
___<µ1 - µ2 < ____
Yes/No____ because the confidence interval contains only
positive values/only negative values/zero ______.
E.
Construct a confidence interval suitable for testing claim that
students taking non proctored tests get higher mean score than
those taking proctored tests.
___<µ1 - µ2 < ____
Yes/No____ because the confidence interval contains only...
A.
B.
C.
D.
Construct a confidence interval suitable for testing claim that
students taking non proctored tests get higher mean score than
those taking proctored tests.
___<µ1 - µ2 < ____
Yes/No____ because the confidence interval contains only
positive values/only negative values/zero ______.
E.
Construct a confidence interval suitable for testing claim that
students taking non proctored tests get higher mean score than
those taking proctored tests.
___<µ1 - µ2 < ____
Yes/No____ because the confidence interval contains only...
A study was done using a treatment group and a placebo group. The results are shown...
 A study was done using a treatment group and a placebo group. The results are shown in the table. Assume that the two samples are independent simple random samples selected from normally distributed populations, and do not assume that the population standard deviations are equal. Complete parts (a) and (b) below. Use a 0.10 significance level for both parts. n Treatment Placebo H2 34 40 2.39 2.62 0.56 0.85 X S UU. 110 H1 H2 H:H1 H2 UU. 110-11-12 HH1...
I just need Help with part B please A study was done using a treatment group...
 I just need Help with part B please
A study was done using a treatment group and a placebo group. The results are shown in the table. Assume that the two samples are independent simple random samples selected from normally distributed populations, and do not assume that the population standard deviations are equal. Complete parts (a) and n (b) below. Use a 0.01 significance level for both parts. X Treatment Placebo 11 HE 27 31 2.38 2.62 0.89 0.62 HH,...
I just need Help with part B please
A study was done using a treatment group and a placebo group. The results are shown in the table. Assume that the two samples are independent simple random samples selected from normally distributed populations, and do not assume that the population standard deviations are equal. Complete parts (a) and n (b) below. Use a 0.01 significance level for both parts. X Treatment Placebo 11 HE 27 31 2.38 2.62 0.89 0.62 HH,...
9.2.01 Treatment Placebo group and from norruse 0.055 A study was done using a treatment group...
 9.2.01 Treatment Placebo group and from norruse 0.055 A study was done using a treatment group and a placebo group. The results are shown in the table. Assume that the two samples are independent simple random samples selected from normally distributed populations, and do not assume that the population standard deviations are equal. Complete parts (a) and (b) below. Use a 0.05 significance level for both parts. n x 25 2.31 0.66 2.61 0.92 O C. Ho: H1 H2 Hy:...
 V2 Given in the table are the BMI statistics for random samples of men and women. Assume that the two samples are independent simple random samples selected from normally distributed populations, and do not assume that the population standard deviations are equal. Complete parts (a) and (b) below. Use a 0.05 significance level for both parts. P1 40 28.4029 7.020534 X 40 24.8792 4.562776 5 OC. Hoy H2 HH1 H2 D. Ho: 11 12 на: 4 #2 The test statistic,...
 Given in the table are the BMI statistics for random samples of men and women. Assume that the two samples are independent simple random samples selected from normally distributed populations, and do not assume that the population standard deviations are equal. Use a 0.01 significance level. n Male BMI 1 43 27.7446 7.796304 Female BMI H2 43 25.6933 4.135821 х S Construct a confidence interval suitable for testing the claim that males and females have the same mean BMI. (<47-H...
 Stat Ohe sum Save Homework: Ch9 Homework HW Score: 44.51 % , 39.62 of 89 pts 10 of 16 (11 complete) Score: 3.5 of 7 pts Question Help 9.2.11-T Female BMI Male BMI Given in the table are the BMI statistics for random samples of men and women. Assume that the two samples are independent simple random samples selected from normally distributed populations, and do not assume that the population standard deviations are equal. Complete parts (a) and (b) below....
 A.
B.
2. The test statistic,is ______
(Round to two decimal places as needed.)
3. The P-value is ______
(Round to three decimal places as needed.)
4. State the conclusion for the test.
________________ the null hypothesis. There ______ sufficient
evidence to support the claim that those treated with magnets have
a greater mean reduction in pain than those given a sham
treatment.
5. Is it valid to argue that magnets might appear to be
effective if the sample sizes...
A.
B.
2. The test statistic,is ______
(Round to two decimal places as needed.)
3. The P-value is ______
(Round to three decimal places as needed.)
4. State the conclusion for the test.
________________ the null hypothesis. There ______ sufficient
evidence to support the claim that those treated with magnets have
a greater mean reduction in pain than those given a sham
treatment.
5. Is it valid to argue that magnets might appear to be
effective if the sample sizes...
 u A study was done on body temperatures of men and women. The results are shown in the table. Assume that the two samples are independent simple random samples selected from normally distributed populations, and do not assume that the population standard deviations are equal. Complete parts (a) and (b) below. Use a 0.05 significance level for both parts Men 11 11 97.76°F 0.81°F Women 2 59 97.45°F 0.71°F S a. Test the claim that men have a higher mean...
 A.
B.
C.
D.
Construct a confidence interval suitable for testing claim that
students taking non proctored tests get higher mean score than
those taking proctored tests.
___<µ1 - µ2 < ____
Yes/No____ because the confidence interval contains only
positive values/only negative values/zero ______.
E.
Construct a confidence interval suitable for testing claim that
students taking non proctored tests get higher mean score than
those taking proctored tests.
___<µ1 - µ2 < ____
Yes/No____ because the confidence interval contains only...
A.
B.
C.
D.
Construct a confidence interval suitable for testing claim that
students taking non proctored tests get higher mean score than
those taking proctored tests.
___<µ1 - µ2 < ____
Yes/No____ because the confidence interval contains only
positive values/only negative values/zero ______.
E.
Construct a confidence interval suitable for testing claim that
students taking non proctored tests get higher mean score than
those taking proctored tests.
___<µ1 - µ2 < ____
Yes/No____ because the confidence interval contains only...
 A study was done using a treatment group and a placebo group. The results are shown in the table. Assume that the two samples are independent simple random samples selected from normally distributed populations, and do not assume that the population standard deviations are equal. Complete parts (a) and (b) below. Use a 0.10 significance level for both parts. n Treatment Placebo H2 34 40 2.39 2.62 0.56 0.85 X S UU. 110 H1 H2 H:H1 H2 UU. 110-11-12 HH1...
 I just need Help with part B please
A study was done using a treatment group and a placebo group. The results are shown in the table. Assume that the two samples are independent simple random samples selected from normally distributed populations, and do not assume that the population standard deviations are equal. Complete parts (a) and n (b) below. Use a 0.01 significance level for both parts. X Treatment Placebo 11 HE 27 31 2.38 2.62 0.89 0.62 HH,...
I just need Help with part B please
A study was done using a treatment group and a placebo group. The results are shown in the table. Assume that the two samples are independent simple random samples selected from normally distributed populations, and do not assume that the population standard deviations are equal. Complete parts (a) and n (b) below. Use a 0.01 significance level for both parts. X Treatment Placebo 11 HE 27 31 2.38 2.62 0.89 0.62 HH,...
 9.2.01 Treatment Placebo group and from norruse 0.055 A study was done using a treatment group and a placebo group. The results are shown in the table. Assume that the two samples are independent simple random samples selected from normally distributed populations, and do not assume that the population standard deviations are equal. Complete parts (a) and (b) below. Use a 0.05 significance level for both parts. n x 25 2.31 0.66 2.61 0.92 O C. Ho: H1 H2 Hy:...
Most questions answered within 3 hours.
-
Investor company owns 35% of investee company voting stock and
accounts for the investment under the...
asked 1 minute ago -
The number of major faults on a randomly chosen 1 km stretch of
highway has a...
asked 26 minutes ago -
Consider the competitive environment of Starbuck's, Progressive
Insurance, a manufacturing firm with low turnover, or a...
asked 1 hour ago -
3. Gains from trade
Consider two neighbouring island countries called Euphoria and
Contente. They each have...
asked 3 hours ago -
A business executive has the option to invest money in two
plans: Plan A guarantees that...
asked 5 hours ago -
Hello, can someone please help me answer this question?
How much heat is absorbed by a...
asked 5 hours ago -
. A marketing researcher conducted a survey of 25 shoppers
randomly selected at the local mall...
asked 5 hours ago -
Create an comprehensive response to the
following:
Antimicrobial agents work on a multitude of microbes (bacteria,...
asked 5 hours ago -
6.13 LAB: Step counter. Section 6.3.
A pedometer treats walking 2,000 steps as walking 1 mile....
asked 5 hours ago -
(14.2) A block of mass m = 10 kg riding on a frictionless
horizontal plane is...
asked 5 hours ago -
Use any search engine to search for articles about Starbucks
partnership with Tata Companies in India...
asked 5 hours ago -
Let’s say that for some reason Bank Excess Reserves suddenly
increase sharply. What effect would this...
asked 5 hours ago