You find a correlation between enthusiasm for Cookies and happiness of r = .8. For 12...
You find a correlation between enthusiasm for Cookies and happiness of r = .8. For 12 participants, your sum of cookie enthusiasm (i.e., sum of X) was 120, (sum of X-squared = 1,308), and your sum for happiness (sum of Y) was 144 (sum of Y-squared = 1,920).
Based on this information, calculate the regression equation that
predicts happiness as a function of cookie enthusiasm.
Make predictions about happiness values for cookie enthusiasm
scores of 3 and 10.
Show all relevant work for all components of this problem.
Homework Answers
Solution:
Given:
x = cookie enthusiasm
y = happiness
Correlation coefficient = r = 0.8
n = 12


Calculate the regression equation that predicts happiness as a function of cookie enthusiasm.

where


thus


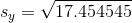

and
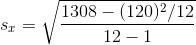


thus

and

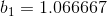
where


thus


thus the regression equation that predicts happiness as a function of cookie enthusiasm is:

(Round final answer to specified number of decimal places)
Make predictions about happiness values for cookie enthusiasm scores of 3 and 10.
Let x = 3,


(Round final answer to specified number of decimal places)
Let x = 10


Add Answer to:
You find a correlation between enthusiasm for Cookies and
happiness of r = .8. For 12...
Imagine that the linear correlation between variables X and Y is r = 0.35. Further imagine...
Imagine that the linear correlation between variables X and Y is r = 0.35. Further imagine that the mean of variable X is 4 and that the mean of variable Y is 6. If we correctly calculated a simple linear regression equation to predict values of Y (based on the corresponding value of X), how much error could we remove from our predictions, relative to just guessing the mean of Y = 6 for everyone in the data set?
please show step by step work. 4. Scatter plots and calculating correlation Suppose you are given...
 please show step by step work.
4. Scatter plots and calculating correlation Suppose you are given the following five pairs of scores: X Y 0 10 Create a scatter diagram of these scores in the following diagram. For each of the five Cx. v) pain, elik on the plotting embel (the black xi.e upper right corner of the tool, and drag it to the approcriate location on the grid Based on your scatter diagram, you would expect the correlation to...
please show step by step work.
4. Scatter plots and calculating correlation Suppose you are given the following five pairs of scores: X Y 0 10 Create a scatter diagram of these scores in the following diagram. For each of the five Cx. v) pain, elik on the plotting embel (the black xi.e upper right corner of the tool, and drag it to the approcriate location on the grid Based on your scatter diagram, you would expect the correlation to...
If a researcher obtained an r of -0.85, what could you say about this correlation? -...
 If a researcher obtained an r of -0.85, what could you say about this correlation? - This is a strong negative correlation. O This is a strong positive correlation. O This is a weak negative correlation. O This is a weak positive correlation. Question 4 1 pts If a researcher wanted to see if cumulative GPA predicts GRE scores, which of the two variables would be the predictor variable? The number of participants None of the other answers O GRE...
QUESTION 26 A cognitive psychologist conducted a study of whether familiarity of words (X) predicts the...
 QUESTION 26 A cognitive psychologist conducted a study of whether familiarity of words (X) predicts the time it takes (in seconds) to press a button indicating whether the word is singular or plural (Y), with all participants being given the same words. Familiarity with these words was rated at a later time on a 7-point scale (with higher numbers indicating more familiarity). The participants' scores were: X Y 6 0.3 1.5 5 0.8 2 3 1.4 Based on these data...
11-13 please 11) (3) Answer the three questions below about the correlation coefficient, r. a. (1)...
 11-13 please
11) (3) Answer the three questions below about the correlation coefficient, r. a. (1) What is the range of values that can take on? b. (1) For what value(s) of r will be predictions be best? c(1) For what value(s) of r will be predictions be worst? 12) (7) Researchers are interested in the relationship between children's IQ and the size of a family. The following hypothetical data represent eight families. number of children (X) 4 2 2...
11-13 please
11) (3) Answer the three questions below about the correlation coefficient, r. a. (1) What is the range of values that can take on? b. (1) For what value(s) of r will be predictions be best? c(1) For what value(s) of r will be predictions be worst? 12) (7) Researchers are interested in the relationship between children's IQ and the size of a family. The following hypothetical data represent eight families. number of children (X) 4 2 2...
3. You have been asked to find if there is a correlation between the amount of...
 3. You have been asked to find if there is a correlation between the amount of calories per serving in a bowl of cereal versus the amount of sugar (in grams) in the cereal. The following data has been given for examination. Calories Sugar 18 200 23 210 12 170 12 190 37 220 19 175 23 201 22 210 32 210 11 190 11 197 205 29 a. Create a scatterplot of the given data. Be sure you explain...
Home X Correlation coefficient Calcula x Conduct and interpreta Bivar: X R Variance cakulator X 10:2...
 Home X Correlation coefficient Calcula x Conduct and interpreta Bivar: X R Variance cakulator X 10:2 Homework X + bocc.instructure.com/courses/20438/assignments/257886 मैं Time Clock Plus MAT 107 8568 > Assignments > 10.2 Homework SUM I 2000 10.2 Homework Home Due Sunday by 11:59pm Points 5 Submitting an external tool Available Jul 7 at 12am. Aug 2 at 11:59pm 27 days Announcements Grades 10.2 Homework Score: 3.5/5 3/5 answered Done Syllabus Modules Question 4 < > B0/1 pt 100 99 Assignments Discussions...
Erika Diaz Your name Assignment 10 Correlation, Scatterplot, and Prediction (due 7/30/20 - 1/4/20)(28 pts) 1....
 Erika Diaz Your name Assignment 10 Correlation, Scatterplot, and Prediction (due 7/30/20 - 1/4/20)(28 pts) 1. A teacher hypothesizes that the more days of school student misses, the worse the student will do on a final exam (possible scores on the exam range from 0 to 20). She obtained a random sample of 12 students. The data are shown below. Student days missed Final exam score 1 3 16 2 2 17 3 5 13 4 8 7 5 4...
In Professor Friedman's economics course the correlation between the students' total scores before the final examination and their final examination scores is r-0.56.
 In Professor Friedman's economics course the correlation between the students' total scores before the final examination and their final examination scores is r-0.56. The pre-exam totals for all students in the course have mean 286 and standard deviation 28, The final exam scores have mean 90 and standard deviation 9. Professor Friedman has lost Julie's final exam but knows that her total before the exam was 320, He decides to predict Julie's final exam score from her pre exam total. Question...
A psychologist wanted to assess the relationship between depression and self-esteem. She believes that as depression...
A psychologist wanted to assess the relationship between depression and self-esteem. She believes that as depression increases, self-esteem decreases. She asked a group of 25 participants to complete both Beck’s Depression Inventory (Beck, Ward, Mendelson, Mock, & Erbaugh, 1961) and Rosenberg’s Self-Esteem Scale (1965). The data for each participant is as follows: Depression (X) Self-Esteem (Y) 60 11 27 34 15 33 30 24 56 14 52 16 40 23 49 33 24 27 38 26 48 17 58 10...
 please show step by step work.
4. Scatter plots and calculating correlation Suppose you are given the following five pairs of scores: X Y 0 10 Create a scatter diagram of these scores in the following diagram. For each of the five Cx. v) pain, elik on the plotting embel (the black xi.e upper right corner of the tool, and drag it to the approcriate location on the grid Based on your scatter diagram, you would expect the correlation to...
please show step by step work.
4. Scatter plots and calculating correlation Suppose you are given the following five pairs of scores: X Y 0 10 Create a scatter diagram of these scores in the following diagram. For each of the five Cx. v) pain, elik on the plotting embel (the black xi.e upper right corner of the tool, and drag it to the approcriate location on the grid Based on your scatter diagram, you would expect the correlation to...
 If a researcher obtained an r of -0.85, what could you say about this correlation? - This is a strong negative correlation. O This is a strong positive correlation. O This is a weak negative correlation. O This is a weak positive correlation. Question 4 1 pts If a researcher wanted to see if cumulative GPA predicts GRE scores, which of the two variables would be the predictor variable? The number of participants None of the other answers O GRE...
 QUESTION 26 A cognitive psychologist conducted a study of whether familiarity of words (X) predicts the time it takes (in seconds) to press a button indicating whether the word is singular or plural (Y), with all participants being given the same words. Familiarity with these words was rated at a later time on a 7-point scale (with higher numbers indicating more familiarity). The participants' scores were: X Y 6 0.3 1.5 5 0.8 2 3 1.4 Based on these data...
 11-13 please
11) (3) Answer the three questions below about the correlation coefficient, r. a. (1) What is the range of values that can take on? b. (1) For what value(s) of r will be predictions be best? c(1) For what value(s) of r will be predictions be worst? 12) (7) Researchers are interested in the relationship between children's IQ and the size of a family. The following hypothetical data represent eight families. number of children (X) 4 2 2...
11-13 please
11) (3) Answer the three questions below about the correlation coefficient, r. a. (1) What is the range of values that can take on? b. (1) For what value(s) of r will be predictions be best? c(1) For what value(s) of r will be predictions be worst? 12) (7) Researchers are interested in the relationship between children's IQ and the size of a family. The following hypothetical data represent eight families. number of children (X) 4 2 2...
 3. You have been asked to find if there is a correlation between the amount of calories per serving in a bowl of cereal versus the amount of sugar (in grams) in the cereal. The following data has been given for examination. Calories Sugar 18 200 23 210 12 170 12 190 37 220 19 175 23 201 22 210 32 210 11 190 11 197 205 29 a. Create a scatterplot of the given data. Be sure you explain...
 Home X Correlation coefficient Calcula x Conduct and interpreta Bivar: X R Variance cakulator X 10:2 Homework X + bocc.instructure.com/courses/20438/assignments/257886 मैं Time Clock Plus MAT 107 8568 > Assignments > 10.2 Homework SUM I 2000 10.2 Homework Home Due Sunday by 11:59pm Points 5 Submitting an external tool Available Jul 7 at 12am. Aug 2 at 11:59pm 27 days Announcements Grades 10.2 Homework Score: 3.5/5 3/5 answered Done Syllabus Modules Question 4 < > B0/1 pt 100 99 Assignments Discussions...
 Erika Diaz Your name Assignment 10 Correlation, Scatterplot, and Prediction (due 7/30/20 - 1/4/20)(28 pts) 1. A teacher hypothesizes that the more days of school student misses, the worse the student will do on a final exam (possible scores on the exam range from 0 to 20). She obtained a random sample of 12 students. The data are shown below. Student days missed Final exam score 1 3 16 2 2 17 3 5 13 4 8 7 5 4...
 In Professor Friedman's economics course the correlation between the students' total scores before the final examination and their final examination scores is r-0.56. The pre-exam totals for all students in the course have mean 286 and standard deviation 28, The final exam scores have mean 90 and standard deviation 9. Professor Friedman has lost Julie's final exam but knows that her total before the exam was 320, He decides to predict Julie's final exam score from her pre exam total. Question...
Most questions answered within 3 hours.
-
The reach and involvement of the federal government, in terms of
its role in disaster relief,...
asked 8 seconds from now -
Problem: The equilibrium constant, Keq, is 5 x 10^-11 m HCO3
<-----------> H^+ + CO3^-2 Calculate...
asked 6 minutes ago -
Explain how blackbody radiation led to the idea of "quanta."
Will rate answer!
asked 12 minutes ago -
Two noble gases (Ne and He) are injected into the chambers of an
insulated container. Each...
asked 7 minutes ago -
Suppose you purchase a zero coupon bond with a face value of
$1,000, maturing in 18...
asked 12 minutes ago -
Do you believe that the $785,000 amount at the center of the
Overstock-Grant Thornton dispute was...
asked 13 minutes ago -
Find and , the mean and standard deviation of the
sampling distribution of :
μ = 25,...
asked 37 minutes ago -
According to the manufacturer of a certain candy, 9% of the
candy produced are red. If...
asked 55 minutes ago -
A Eucher Deck consists of 24 cards. In a four- player game, each
player is dealt...
asked 1 hour ago -
This is a challenging question.
The titration of an impure sample of KHP found that 36.00...
asked 1 hour ago -
1. Starting from rest, an automatic subway train is controlled
by a computer
that causes it’s...
asked 37 minutes ago -
You place a block of
ice (mass of 3 kg) into a test chamber filled with...
asked 1 hour ago