


Homework Answers


Add Answer to:
please show step by step work.
4. Scatter plots and calculating correlation Suppose you are given...
4. Scatter plots and calculating correlation
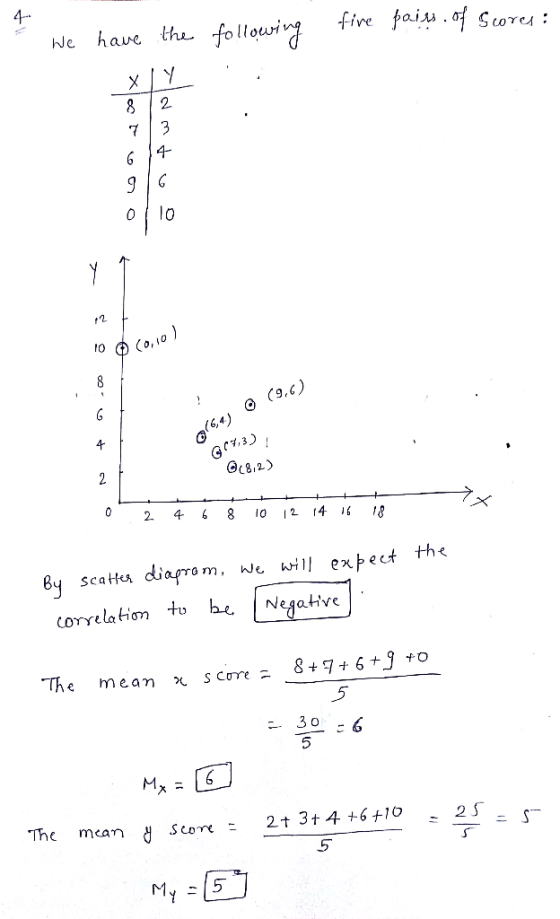
 4. Scatter plots and calculating correlation Suppose you are given the following five pairs of scores: XY61926384110Create a scatter plot of these scores in the following diagram. For each of the five (X,Y) pairs, click on the plotting symbol (the black X) in the upper right corner of the tool, and drag it to the appropriate location on the grid. Based on your scatter plot, you would expect the correlation to be _______ .The mean X score is Mx = _______ , and...
This is Correlation and Introduction to Regression ! please SHOW YOUR WORK. please don't use SPSS....
This is Correlation and Introduction to Regression ! please SHOW YOUR WORK. please don't use SPSS. all work must calculate by hand and show step by step. thanks Calculate SP (the sum of products of deviations) for the following scores. (2pts) X Y 0 4 1 1 0 5 4 1 2 1 1 3
5. Calculating the Pearson correlation and the coefficient of determination
 5. Calculating the Pearson correlation and the coefficient of determinationSuppose you are interested in seeing whether the total number of days students are absent from high school correlates with their grades. You obtain school records that list the total absences and average grades (on a percentage scale) for 80 graduating seniors.You decide to use the computational formula to calculate the Pearson correlation between the total number of absences and average grades. To do so, you call the total number of...
Questions 1,2,3 and 4 With steps please 4. Using data 4.1 Scatter graphs and correlation Ten...
 Questions 1,2,3 and 4
With steps please
4. Using data 4.1 Scatter graphs and correlation Ten identical houses had their lofts converted. These scatter graphs show the number of workers, time taken and cost of equipment hire for each loft. Cost of equipment hire () Time taken (weeks) 0310 Number of workers bij Number of workers a Describe the correlation between the number of workers and the time taken. b Describe the correlation between the number of workers and the...
Questions 1,2,3 and 4
With steps please
4. Using data 4.1 Scatter graphs and correlation Ten identical houses had their lofts converted. These scatter graphs show the number of workers, time taken and cost of equipment hire for each loft. Cost of equipment hire () Time taken (weeks) 0310 Number of workers bij Number of workers a Describe the correlation between the number of workers and the time taken. b Describe the correlation between the number of workers and the...
The Correlation and Regression Applet allows you to animate the given figure. Click to create a...
 The Correlation and Regression Applet allows you to animate the given figure. Click to create a group of 10 points in the lower-left corner of the scatterplot with a strong straight-line pattern (correlation approximately 0.9). Click the "Show least-squares line" box to display the regression line. Move the outlier down Subject 16 Removing Subject 16 moves the regression line only a little. and the least-squares line chases it down 20 40 60 80 100 20 40 Empathy score 60 80...
(a) A study was conducted to determine whether the yield of olive oil is associated with...
 (a) A study was conducted to determine whether the yield of olive oil is associated with the average temperature of the area. The data in the table below provide the average kilograms of olive oil per tree (y) and the average temperature (2), measured in degrees Celsius. The data correspond to areas taken for 12 different countries. Average temperature (2) 5 7.5 5 7 8 3 2 8 11 4 5 Olive oil yield (y) 10 20 15 17 25...
In the United States, tyre tread depth is measured in 32nds of an inch. Car tyres typically start out with 10/32 to 11/32 of an inch of tread depth. In most states, a tyre is legally worn out when...
 In the United States, tyre tread depth is measured in 32nds of an inch. Car tyres typically start out with 10/32 to 11/32 of an inch of tread depth. In most states, a tyre is legally worn out when its tread depth reaches 2/32 of an inch. A random sample of four tyres provides the following data on distance driven and tread depth: Distance driven Tread Depth (32nds of an inch) Tyre (10,000 kilometres) 2 3 4 4 4 4...
Please answer all fill in the blanks, thanks! In the United States, tire tread depth is...
 Please answer all fill in the blanks, thanks!
In the United States, tire tread depth is measured in 32nds of an inch. Car tires typically start out with 10/32 to 11/32 of an inch of tread depth. In most states, a tire is legally worn out when its tread depth reaches 2/32 of an inch. A random sample of four tires provides the following data on mileage and tread depth: Mileage (10,000 miles) Tread Depth (32nds of an inch) Tire...
Please answer all fill in the blanks, thanks!
In the United States, tire tread depth is measured in 32nds of an inch. Car tires typically start out with 10/32 to 11/32 of an inch of tread depth. In most states, a tire is legally worn out when its tread depth reaches 2/32 of an inch. A random sample of four tires provides the following data on mileage and tread depth: Mileage (10,000 miles) Tread Depth (32nds of an inch) Tire...
Can you please answers these four questions as aoin as possible please and thank you! Given...
 Can you please answers these four questions as aoin as
possible please and thank you!
Given are five observations for two variables, z and y 5 13 20 18 48 57 11 27 a. Choose the corre rect scatter diagram for these data: A. B. 60+ 60 50 50 40 40 30+ 30 20 20 10 10- 10 20 30 40 50 60 x 10 20 30 40 50 60 57 x y 60 60 50+ 50- 40- 40+ 30-...
Can you please answers these four questions as aoin as
possible please and thank you!
Given are five observations for two variables, z and y 5 13 20 18 48 57 11 27 a. Choose the corre rect scatter diagram for these data: A. B. 60+ 60 50 50 40 40 30+ 30 20 20 10 10- 10 20 30 40 50 60 x 10 20 30 40 50 60 57 x y 60 60 50+ 50- 40- 40+ 30-...
6. Interpreting statistical software output in regression Aa Aa Suppose you work in the admission...
 6. Interpreting statistical software output in regression Aa Aa Suppose you work in the admissions department of a small liberal arts college. You wonder if you can predict students' college grade point averages (GPAs) by their SAT scores. You randomly select 50 recent graduates and collect their SAT scores and college GPAs. You use a statistical software package to run a regression predicting college GPA from SAT score. Use the following output to answer the questions that follovw Descriptive Statistics...
 5. Calculating the Pearson correlation and the coefficient of determinationSuppose you are interested in seeing whether the total number of days students are absent from high school correlates with their grades. You obtain school records that list the total absences and average grades (on a percentage scale) for 80 graduating seniors.You decide to use the computational formula to calculate the Pearson correlation between the total number of absences and average grades. To do so, you call the total number of...
 Questions 1,2,3 and 4
With steps please
4. Using data 4.1 Scatter graphs and correlation Ten identical houses had their lofts converted. These scatter graphs show the number of workers, time taken and cost of equipment hire for each loft. Cost of equipment hire () Time taken (weeks) 0310 Number of workers bij Number of workers a Describe the correlation between the number of workers and the time taken. b Describe the correlation between the number of workers and the...
Questions 1,2,3 and 4
With steps please
4. Using data 4.1 Scatter graphs and correlation Ten identical houses had their lofts converted. These scatter graphs show the number of workers, time taken and cost of equipment hire for each loft. Cost of equipment hire () Time taken (weeks) 0310 Number of workers bij Number of workers a Describe the correlation between the number of workers and the time taken. b Describe the correlation between the number of workers and the...
 The Correlation and Regression Applet allows you to animate the given figure. Click to create a group of 10 points in the lower-left corner of the scatterplot with a strong straight-line pattern (correlation approximately 0.9). Click the "Show least-squares line" box to display the regression line. Move the outlier down Subject 16 Removing Subject 16 moves the regression line only a little. and the least-squares line chases it down 20 40 60 80 100 20 40 Empathy score 60 80...
 (a) A study was conducted to determine whether the yield of olive oil is associated with the average temperature of the area. The data in the table below provide the average kilograms of olive oil per tree (y) and the average temperature (2), measured in degrees Celsius. The data correspond to areas taken for 12 different countries. Average temperature (2) 5 7.5 5 7 8 3 2 8 11 4 5 Olive oil yield (y) 10 20 15 17 25...
 In the United States, tyre tread depth is measured in 32nds of an inch. Car tyres typically start out with 10/32 to 11/32 of an inch of tread depth. In most states, a tyre is legally worn out when its tread depth reaches 2/32 of an inch. A random sample of four tyres provides the following data on distance driven and tread depth: Distance driven Tread Depth (32nds of an inch) Tyre (10,000 kilometres) 2 3 4 4 4 4...
 Please answer all fill in the blanks, thanks!
In the United States, tire tread depth is measured in 32nds of an inch. Car tires typically start out with 10/32 to 11/32 of an inch of tread depth. In most states, a tire is legally worn out when its tread depth reaches 2/32 of an inch. A random sample of four tires provides the following data on mileage and tread depth: Mileage (10,000 miles) Tread Depth (32nds of an inch) Tire...
Please answer all fill in the blanks, thanks!
In the United States, tire tread depth is measured in 32nds of an inch. Car tires typically start out with 10/32 to 11/32 of an inch of tread depth. In most states, a tire is legally worn out when its tread depth reaches 2/32 of an inch. A random sample of four tires provides the following data on mileage and tread depth: Mileage (10,000 miles) Tread Depth (32nds of an inch) Tire...
 Can you please answers these four questions as aoin as
possible please and thank you!
Given are five observations for two variables, z and y 5 13 20 18 48 57 11 27 a. Choose the corre rect scatter diagram for these data: A. B. 60+ 60 50 50 40 40 30+ 30 20 20 10 10- 10 20 30 40 50 60 x 10 20 30 40 50 60 57 x y 60 60 50+ 50- 40- 40+ 30-...
Can you please answers these four questions as aoin as
possible please and thank you!
Given are five observations for two variables, z and y 5 13 20 18 48 57 11 27 a. Choose the corre rect scatter diagram for these data: A. B. 60+ 60 50 50 40 40 30+ 30 20 20 10 10- 10 20 30 40 50 60 x 10 20 30 40 50 60 57 x y 60 60 50+ 50- 40- 40+ 30-...
 6. Interpreting statistical software output in regression Aa Aa Suppose you work in the admissions department of a small liberal arts college. You wonder if you can predict students' college grade point averages (GPAs) by their SAT scores. You randomly select 50 recent graduates and collect their SAT scores and college GPAs. You use a statistical software package to run a regression predicting college GPA from SAT score. Use the following output to answer the questions that follovw Descriptive Statistics...
Most questions answered within 3 hours.
-
Angel Corporation has $10,000,000 of
8.0% 25 year bonds dated May 1, 2018 with interest payable...
asked 20 minutes ago -
7.
________ involves individuals trading goods they already have or
providing services in exchange for something...
asked 24 minutes ago -
Share your research problem. What databases did you search as
you gathered evidence to support your...
asked 24 minutes ago -
what process occurs to form microspores and megaspores in flowering
plants?
asked 31 minutes ago -
C++
I need to use the function getData to put in all my data using
arrays....
asked 31 minutes ago -
A block is hung by a string from the inside roof of a van. When
the...
asked 38 minutes ago -
Do you think companies should not go for long term debt in their
capital structure to...
asked 46 minutes ago -
I create an address book where the user enters the name, phone
and email in the...
asked 52 minutes ago -
The production capacity for acrylonitrile
(C3H3N) in the United States exceeds 2
million pounds per year....
asked 1 hour ago -
explain and comment out your answer
43. How many address lines are required to address a...
asked 1 hour ago -
A sample of 45 observations is selected from a normal
population. The sample mean is 49,...
asked 1 hour ago -
A construction company is planning to bid on a building
contract. The bid costs the company...
asked 1 hour ago