This is Correlation and Introduction to Regression ! please SHOW YOUR WORK. please don't use SPSS....
This is Correlation and Introduction to Regression ! please SHOW YOUR WORK. please don't use SPSS. all work must calculate by hand and show step by step. thanks
- Calculate SP (the sum of products of deviations) for the following scores. (2pts)
|
X |
Y |
|
0 |
4 |
|
1 |
1 |
|
0 |
5 |
|
4 |
1 |
|
2 |
1 |
|
1 |
3 |
Homework Answers
| x | y |
x- |
(x-)^2 |
y- |
(y-)^2 |
(x-)*(y-) |
|
| 0 | 4 | -1.33 | 1.7689 | 1.5 | 2.25 | -1.995 | |
| 1 | 1 | -0.33 | 0.1089 | -1.5 | 2.25 | 0.495 | |
| 0 | 5 | -1.33 | 1.7689 | 2.5 | 6.25 | -3.325 | |
| 4 | 1 | 2.67 | 7.1289 | -1.5 | 2.25 | -4.005 | |
| 2 | 1 | 0.67 | 0.4489 | -1.5 | 2.25 | -1.005 | |
| 1 | 3 | -0.33 | 0.1089 | 0.5 | 0.25 | -0.165 | |
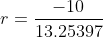
| Total | 8 | 15 | 11.3334 | 15.5 | -10 |
The mean of x is given by:


The mean of y is


The correlation coefficient is given by:


Add Answer to:
This is Correlation and Introduction to Regression !
please SHOW YOUR WORK. please don't use SPSS....
please show step by step work. 4. Scatter plots and calculating correlation Suppose you are given...
 please show step by step work.
4. Scatter plots and calculating correlation Suppose you are given the following five pairs of scores: X Y 0 10 Create a scatter diagram of these scores in the following diagram. For each of the five Cx. v) pain, elik on the plotting embel (the black xi.e upper right corner of the tool, and drag it to the approcriate location on the grid Based on your scatter diagram, you would expect the correlation to...
please show step by step work.
4. Scatter plots and calculating correlation Suppose you are given the following five pairs of scores: X Y 0 10 Create a scatter diagram of these scores in the following diagram. For each of the five Cx. v) pain, elik on the plotting embel (the black xi.e upper right corner of the tool, and drag it to the approcriate location on the grid Based on your scatter diagram, you would expect the correlation to...
Correlation and Introduction to Regression PLEASE SHOW ALL WORKS. PLEASE CALCULATE BY HAND STEP BY STEP....
Correlation and Introduction to Regression PLEASE SHOW ALL WORKS. PLEASE CALCULATE BY HAND STEP BY STEP. Below are the data for six participants giving their number of years in college (X) and their subsequent yearly income (Y). Income here is in thousands of dollars, but this does not require any changes in our computations. Test whether there is a relationship with α=.05. (5pts) X Y 0 15 1 15 3 20 4 25 4 30 6 35
4. Scatter plots and calculating correlation
 4. Scatter plots and calculating correlation Suppose you are given the following five pairs of scores: XY61926384110Create a scatter plot of these scores in the following diagram. For each of the five (X,Y) pairs, click on the plotting symbol (the black X) in the upper right corner of the tool, and drag it to the appropriate location on the grid. Based on your scatter plot, you would expect the correlation to be _______ .The mean X score is Mx = _______ , and...
correlation and regression 210 Statistics EXTRA CREDIT Correlation and Regression Formulas written Assignment 1. Follow the...
 correlation and regression
210 Statistics EXTRA CREDIT Correlation and Regression Formulas written Assignment 1. Follow the instructions below to calculate the correlation coefficient and least squares regression line for the data set below. Z 22,- The sample means and sample standard deviations for the two variables are listed below: X = 4 x = 2 3 =5 Sy = 1 The linear correlation coefficient is = 52. Calculate this correlation coefficient using the steps below: (a) First, complete the columns...
correlation and regression
210 Statistics EXTRA CREDIT Correlation and Regression Formulas written Assignment 1. Follow the instructions below to calculate the correlation coefficient and least squares regression line for the data set below. Z 22,- The sample means and sample standard deviations for the two variables are listed below: X = 4 x = 2 3 =5 Sy = 1 The linear correlation coefficient is = 52. Calculate this correlation coefficient using the steps below: (a) First, complete the columns...
Show work please, Thanks! Question 3: The regression line equation for a set of data is...
 Show work please, Thanks!
Question 3: The regression line equation for a set of data is given by y-hat = 2.3x+5 with n = 10. The mean value of y is 10.1 for the data set. Use a = 0.05. A. If the linear correlation coefficient is r=0.521, what is the best predicted y-value for x = 5? Justify for your answer. B. If the linear correlation coefficient is r = 0.972, what is the best predicted y-value for x...
Show work please, Thanks!
Question 3: The regression line equation for a set of data is given by y-hat = 2.3x+5 with n = 10. The mean value of y is 10.1 for the data set. Use a = 0.05. A. If the linear correlation coefficient is r=0.521, what is the best predicted y-value for x = 5? Justify for your answer. B. If the linear correlation coefficient is r = 0.972, what is the best predicted y-value for x...
Erika Diaz Your name Assignment 10 Correlation, Scatterplot, and Prediction (due 7/30/20 - 1/4/20)(28 pts) 1....
 Erika Diaz Your name Assignment 10 Correlation, Scatterplot, and Prediction (due 7/30/20 - 1/4/20)(28 pts) 1. A teacher hypothesizes that the more days of school student misses, the worse the student will do on a final exam (possible scores on the exam range from 0 to 20). She obtained a random sample of 12 students. The data are shown below. Student days missed Final exam score 1 3 16 2 2 17 3 5 13 4 8 7 5 4...
please show work 1. Regression and Correlation An experiment was conducted to study the effect of...
 please show work
1. Regression and Correlation An experiment was conducted to study the effect of increasing the dosage of a on sleeping time. Three readings were made at each of three dose levels certain barbiturate Sleeping Time (Hours) Dosage (11 μM/kg) 4 10 10 9 15 15 15 13 9 ΣΥ-642, ΣXY = 780 2X 84, ΣΧ2 1002, ΣΧΥ 780 ΣΥ-72, a. Plot the scatter Diagram b. Determine the Correlation Coefficient "r" and the coefficient of determination "R2n c....
please show work
1. Regression and Correlation An experiment was conducted to study the effect of increasing the dosage of a on sleeping time. Three readings were made at each of three dose levels certain barbiturate Sleeping Time (Hours) Dosage (11 μM/kg) 4 10 10 9 15 15 15 13 9 ΣΥ-642, ΣXY = 780 2X 84, ΣΧ2 1002, ΣΧΥ 780 ΣΥ-72, a. Plot the scatter Diagram b. Determine the Correlation Coefficient "r" and the coefficient of determination "R2n c....
please show your work step by step, don't put it in writing sometime i can't read...
 please show your work step by step, don't put it in writing sometime i can't
read it, use excel its very important, show me the formula so i can
see how u do it
The following is a set of data from a sample of n = 11 items. Complete parts (a) through (c). o X Y 16 32 8 16 17 34 12 24 18 36 3 6 10 20 19 38 4 8 7 14 15 30 a....
please show your work step by step, don't put it in writing sometime i can't
read it, use excel its very important, show me the formula so i can
see how u do it
The following is a set of data from a sample of n = 11 items. Complete parts (a) through (c). o X Y 16 32 8 16 17 34 12 24 18 36 3 6 10 20 19 38 4 8 7 14 15 30 a....
For the following problems, do not use statistical software such as SPSS, SAS, R and so...
For the following problems, do not use statistical software such as SPSS, SAS, R and so on. Please nish your work only using basic calculator and describe how you get your answer. X 3 6 8 2 5 1 5 Y 4 5 6 2 5 0 3 (a) Compute the sample covariance of X and Y and explain how X and Y are related. (b) Compute the sample correlation coecient and explain its meaning. (c) Consider the simple linear...
Part II: SPSS Application These questions require the use of SPSS. Remember you must submit all of your work within this word document. You will need to take a screen shot of your data view if necessa...
Part II: SPSS Application These questions require the use of SPSS. Remember you must submit all of your work within this word document. You will need to take a screen shot of your data view if necessary, or copy and paste your output into the spaces below. Remember to report the exact p value provided by SPSS output – simply reporting p<.05 or p>.05 is not acceptable (unless SPSS output states p=.000 – in that case you can report p<.001)....
 please show step by step work.
4. Scatter plots and calculating correlation Suppose you are given the following five pairs of scores: X Y 0 10 Create a scatter diagram of these scores in the following diagram. For each of the five Cx. v) pain, elik on the plotting embel (the black xi.e upper right corner of the tool, and drag it to the approcriate location on the grid Based on your scatter diagram, you would expect the correlation to...
please show step by step work.
4. Scatter plots and calculating correlation Suppose you are given the following five pairs of scores: X Y 0 10 Create a scatter diagram of these scores in the following diagram. For each of the five Cx. v) pain, elik on the plotting embel (the black xi.e upper right corner of the tool, and drag it to the approcriate location on the grid Based on your scatter diagram, you would expect the correlation to...
 correlation and regression
210 Statistics EXTRA CREDIT Correlation and Regression Formulas written Assignment 1. Follow the instructions below to calculate the correlation coefficient and least squares regression line for the data set below. Z 22,- The sample means and sample standard deviations for the two variables are listed below: X = 4 x = 2 3 =5 Sy = 1 The linear correlation coefficient is = 52. Calculate this correlation coefficient using the steps below: (a) First, complete the columns...
correlation and regression
210 Statistics EXTRA CREDIT Correlation and Regression Formulas written Assignment 1. Follow the instructions below to calculate the correlation coefficient and least squares regression line for the data set below. Z 22,- The sample means and sample standard deviations for the two variables are listed below: X = 4 x = 2 3 =5 Sy = 1 The linear correlation coefficient is = 52. Calculate this correlation coefficient using the steps below: (a) First, complete the columns...
 Show work please, Thanks!
Question 3: The regression line equation for a set of data is given by y-hat = 2.3x+5 with n = 10. The mean value of y is 10.1 for the data set. Use a = 0.05. A. If the linear correlation coefficient is r=0.521, what is the best predicted y-value for x = 5? Justify for your answer. B. If the linear correlation coefficient is r = 0.972, what is the best predicted y-value for x...
Show work please, Thanks!
Question 3: The regression line equation for a set of data is given by y-hat = 2.3x+5 with n = 10. The mean value of y is 10.1 for the data set. Use a = 0.05. A. If the linear correlation coefficient is r=0.521, what is the best predicted y-value for x = 5? Justify for your answer. B. If the linear correlation coefficient is r = 0.972, what is the best predicted y-value for x...
 Erika Diaz Your name Assignment 10 Correlation, Scatterplot, and Prediction (due 7/30/20 - 1/4/20)(28 pts) 1. A teacher hypothesizes that the more days of school student misses, the worse the student will do on a final exam (possible scores on the exam range from 0 to 20). She obtained a random sample of 12 students. The data are shown below. Student days missed Final exam score 1 3 16 2 2 17 3 5 13 4 8 7 5 4...
 please show work
1. Regression and Correlation An experiment was conducted to study the effect of increasing the dosage of a on sleeping time. Three readings were made at each of three dose levels certain barbiturate Sleeping Time (Hours) Dosage (11 μM/kg) 4 10 10 9 15 15 15 13 9 ΣΥ-642, ΣXY = 780 2X 84, ΣΧ2 1002, ΣΧΥ 780 ΣΥ-72, a. Plot the scatter Diagram b. Determine the Correlation Coefficient "r" and the coefficient of determination "R2n c....
please show work
1. Regression and Correlation An experiment was conducted to study the effect of increasing the dosage of a on sleeping time. Three readings were made at each of three dose levels certain barbiturate Sleeping Time (Hours) Dosage (11 μM/kg) 4 10 10 9 15 15 15 13 9 ΣΥ-642, ΣXY = 780 2X 84, ΣΧ2 1002, ΣΧΥ 780 ΣΥ-72, a. Plot the scatter Diagram b. Determine the Correlation Coefficient "r" and the coefficient of determination "R2n c....
 please show your work step by step, don't put it in writing sometime i can't
read it, use excel its very important, show me the formula so i can
see how u do it
The following is a set of data from a sample of n = 11 items. Complete parts (a) through (c). o X Y 16 32 8 16 17 34 12 24 18 36 3 6 10 20 19 38 4 8 7 14 15 30 a....
please show your work step by step, don't put it in writing sometime i can't
read it, use excel its very important, show me the formula so i can
see how u do it
The following is a set of data from a sample of n = 11 items. Complete parts (a) through (c). o X Y 16 32 8 16 17 34 12 24 18 36 3 6 10 20 19 38 4 8 7 14 15 30 a....
Most questions answered within 3 hours.
-
An environmental economic consulting firm is hired to measure
the negative externalities associated with the pollution...
asked 17 minutes ago -
Express Catering contributed $8,000 to the American Lung
Association. If taxable income, before charitable contribution is...
asked 9 minutes ago -
a raindrop of mass 2.00 g falls on the roof of a car with an
initial...
asked 17 minutes ago -
Why we should not allow the Oil & Gas industry to
explore, exploit and extract oil...
asked 20 minutes ago -
In the readings for this topic, the methods for gathering data are
provided. However, there is...
asked 32 minutes ago -
Select from the option list provided the most likely
classification(s) of net assets, if any, that...
asked 32 minutes ago -
Ivanhoe Corp. management is expecting a project to generate
after-tax income of $76,940 in each of...
asked 35 minutes ago -
An unknown compound contains only CC , HH , and OO . Combustion
of 5.30 g5.30...
asked 41 minutes ago -
List 3 viral classes based on their morphology.
What is the difference between lytic and lysogenic...
asked 42 minutes ago -
Myca Corp. has a project with the following cash flows. What is
the value of the...
asked 1 hour ago -
When an object moves through a fluid, the fluid exerts a viscous
force F on the...
asked 3 hours ago -
Why did the observed chemistry of thallium mislead Mendelev to
place the group 13 element (Tl)...
asked 5 hours ago