 Please Show work. Thanks.
Homework Answers

Add Answer to:
Please Show work. Thanks.
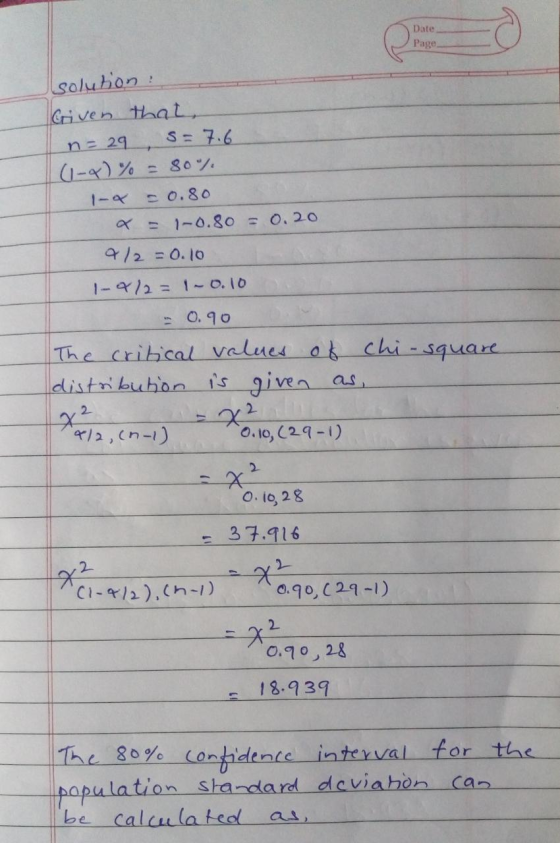
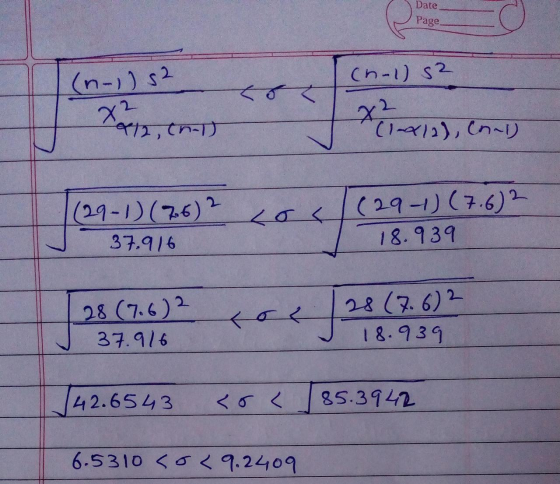
5. Twenty-nine randomly selected women had their Body Mass Indices (BMI) measured....
We have the survey data on the body mass index (BMI) of 642 young women. The...
We have the survey data on the body mass index (BMI) of 642 young women. The mean BMI in the sample was x¯=26.1. We treated these data as an SRS from a Normally distributed population with standard deviation ?=7.3. Give confidence intervals for the mean BMI and the margins of error for 90%, 95%, and 99% confidence. Conf. Level Interval (±±0.01) margins of error (±±0.0001) 90% to 95% to 99% to
We have the survey data on the body mass index (BMI) of 645 young women. The...
 We have the survey data on the body mass index (BMI) of 645 young women. The mean BMI in the sample was X = 28.5. We treated these data as an SRS from a Normally distributed population with standard deviation o = 7.5. Give confidence intervals for the mean BMI and the margins of error for 90%, 95%, and 99% confidence. (Round your answers to two decimal places.) Confidence Level Interval margin of error 90% 95% 99% ggg How does...
(16.09) We have the survey data on the body mass index (BMI) of 640 young women....
(16.09) We have the survey data on the body mass index (BMI) of 640 young women. The mean BMI in the sample was x¯¯¯=26.6x¯=26.6. We treated these data as an SRS from a Normally distributed population with standard deviation σ=σ=7.8 . Find the margins of error for 99 % confidence based on SRSs of N young women. N margins of error (±±0.0001) 139 406 1558 10. (16.10) An SRS of 400 high school seniors gained an average of x¯¯¯x¯ =...
(16.09) We have the survey data on the body mass index (BMI) of 640 young women....
(16.09) We have the survey data on the body mass index (BMI) of 640 young women. The mean BMI in the sample was x¯¯¯=27.9. We treated these data as an SRS from a Normally distributed population with standard deviation σ=7.9. Find the margins of error for 99% confidence based on SRSs of N young women. N margins of error (±0.0001) 132 ____ 375 ____ 1610 ____
(16.09) We have the survey data on the body mass index (BMI) of 645 young women....
(16.09) We have the survey data on the body mass index (BMI) of 645 young women. The mean BMI in the sample was x¯¯¯=27.1x¯=27.1. We treated these data as an SRS from a Normally distributed population with standard deviation σ=σ=7.5. Find the margins of error for 95% confidence based on SRSs of N young women. N margins of error (±±0.0001) 130 419 1626
adult men in the United States are randomly selected and measured for their body mass index...
adult men in the United States are randomly selected and measured for their body mass index (BMI). Based on that sample, it is estimated that the average (mean) BMI for men is 25.5 , with a margin of error of 3.2 . Use the given statistic and margin of error to identify the range of values (confidence interval) likely to contain the true value of the population parameter.
We have survey data on the body mass index (BMI) of 668 young women. The mean...
We have survey data on the body mass index (BMI) of 668 young women. The mean BMI in the sample was x = 25. We treated these data as an SRS from a Normally distributed population with standard deviation σ = 8. (a) Suppose that we had an SRS of just 112 young women. What would be the margin of error for 95% confidence? (Round your answer to four decimal places.) (b) Find the margins of error for 95% confidence...
Please Show Work. Thanks. 3. In a random sample of 193 engineers, 15.2% of them were...
 Please Show Work. Thanks.
3. In a random sample of 193 engineers, 15.2% of them were women. a) Construct an 85% confidence interval for the population proportion, p. Round to tenths of a percent and write a sentence answer. b) Find the margin of error, round to tenths of a percent
Please Show Work. Thanks.
3. In a random sample of 193 engineers, 15.2% of them were women. a) Construct an 85% confidence interval for the population proportion, p. Round to tenths of a percent and write a sentence answer. b) Find the margin of error, round to tenths of a percent
The utility bills (in dollars) of 10 randomly selected homeowners in one city are listed below....
The utility bills (in dollars) of 10 randomly selected homeowners in one city are listed below. Construct a 95% confidence interval for the mean. Assume the population is normally distributed. 70, 72, 71, 70, 69, 73, 69, 68, 70, 78 (68.95, 73.05) (69.00, 78.00) (70.05, 72.95) (68.13, 73.87) Suppose a 98% confidence interval for μ turns out to be (1000, 2100). If this interval was based on a sample of size n = 22, find the value of the margin...
A study of women’s weights found that a randomly selected sample of 150 women had a...
A study of women’s weights found that a randomly selected sample of 150 women had a mean weight of 147.3 lb. Assuming that the population standard deviation is 19.6 lb., construct a 95% confidence interval estimate of the mean weight of all women. Choose the correct interval from below: Choose one • 10 points (144.211, 150.389) (140.611, 146.789) (144.667, 149.933) (144.163, 150.437)
 We have the survey data on the body mass index (BMI) of 645 young women. The mean BMI in the sample was X = 28.5. We treated these data as an SRS from a Normally distributed population with standard deviation o = 7.5. Give confidence intervals for the mean BMI and the margins of error for 90%, 95%, and 99% confidence. (Round your answers to two decimal places.) Confidence Level Interval margin of error 90% 95% 99% ggg How does...
 Please Show Work. Thanks.
3. In a random sample of 193 engineers, 15.2% of them were women. a) Construct an 85% confidence interval for the population proportion, p. Round to tenths of a percent and write a sentence answer. b) Find the margin of error, round to tenths of a percent
Please Show Work. Thanks.
3. In a random sample of 193 engineers, 15.2% of them were women. a) Construct an 85% confidence interval for the population proportion, p. Round to tenths of a percent and write a sentence answer. b) Find the margin of error, round to tenths of a percent
Most questions answered within 3 hours.
-
The average length of time between arrivals at a turnpike
toll-booth is 26 seconds. What is...
asked 30 minutes ago -
(a) A piston at 6.1 atm contains a gas that occupies a volume of
3.5 L....
asked 1 hour ago -
Please answer true or false. Words
cannot be changed or added in to make it true...
asked 1 hour ago -
An empty test tube weighs 15.923 grams. Then,
MgCl2•6H2O is added into the test tube. After...
asked 1 hour ago -
Assume memory access is 10 units of time and disk access is
10000 units of time....
asked 2 hours ago -
1. Are all good samples random?
2. Magazines often report surveys giving statistics such as “63%...
asked 2 hours ago -
Under all the various types of market structures, firms
must eventually earn some economic profits for...
asked 2 hours ago -
Consider the following fitness regime for a single locus trait
with two co-dominant alleles: w11 =...
asked 2 hours ago -
A large cable company reports the following.
80% of its customers subscribe to its cable TV...
asked 2 hours ago -
Please answer the question in brief.
Discuss the role of ERP in organizations. Are ERP tools...
asked 2 hours ago -
Discuss the pros and cons of collaborative software such
as SameTime. Does it increase productivity? What...
asked 2 hours ago -
Buying your in-laws a gift because it’s expected is
due to the ____________ motive of gift-giving....
asked 2 hours ago