
Homework Answers

Add Answer to:
3. For the Data sets in the test scores example, find the following a). The IQR,...
WILSM we sample, what percentagehad starting salaries of lessthan 25,000 3. For the Data sets in...
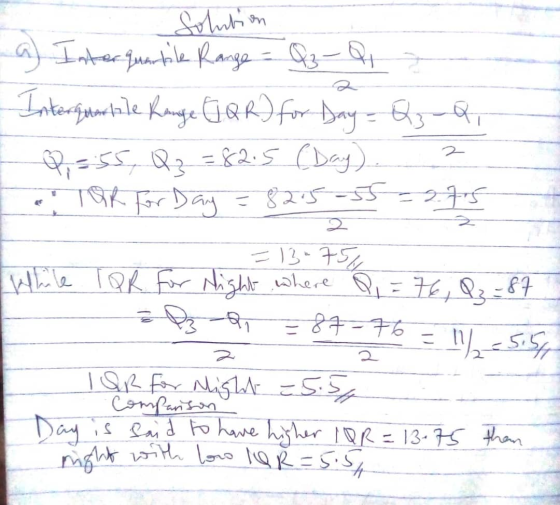
 WILSM we sample, what percentagehad starting salaries of lessthan 25,000 3. For the Data sets in the test scores example, find the following a) The IQR, compare the two interquartile ranges. b). Any Outliers in either set Minimum Q1 Median Q3 Maximum 74.5 Day Night 32 25.5 56 78 82.5 89 99 98 8
Identify potential outliers, if any, for the given data. The test scores of 15 students are...
 Identify potential outliers, if any, for the given data. The test scores of 15 students are listed below. 38 41 56 65 66 68 70 72 74 77 78 82 87 90 99 Steps: 1. Find Q1, Q3, and IQR 2. Find Q1 - 1.5 x IQR 3. Find Q3 +1.5 x IQR 4. Result from step 2 < Possible allowed data <Result from step 3 5. Compare step 4 to your data, find the outliers if they exist 38...
2. Comparing smaller data sets using box plots Two data sets describing the fraction of protein...
 2. Comparing smaller data sets using box plots Two data sets describing the fraction of protein recovered from thirteen test samples by each of two different methods are given in the table below Method1 Method 2 0.32 0.35 0.37 0.39 042 0.47 0.51 0.58 0.60 0.62 0.65 0.68 0.75 0.25 0.40 0.48 0.55 0.56 0.58 0.60 0.65 0.70 0.76 0.80 0.91 0.99 (a) Construct boxplots of the two sets of data. Compare the whisker lengths in the box plots of...
Please draw boxplot 38) [6 points] The test scores of 30 students are listed below. Find...
 Please draw boxplot
38) [6 points] The test scores of 30 students are listed below. Find the five-number summary and then draw a boxplot that represents the data. 31 41 45 48 52 55 56 56 63 65 67 67 69 70 70 74 75 78 79 79ue Ti (al 80 81 83 85 85 87 90 92 95 99 o2:M Q3: Minimum value: Q1: Maximum value: 49 TOBO 40 100 iD 30 4D
Please draw boxplot
38) [6 points] The test scores of 30 students are listed below. Find the five-number summary and then draw a boxplot that represents the data. 31 41 45 48 52 55 56 56 63 65 67 67 69 70 70 74 75 78 79 79ue Ti (al 80 81 83 85 85 87 90 92 95 99 o2:M Q3: Minimum value: Q1: Maximum value: 49 TOBO 40 100 iD 30 4D
b d snd e only Elementary Jon 25 34 Problem #2 (12 points) The following data...
 b d
snd e only
Elementary Jon 25 34 Problem #2 (12 points) The following data set represents the miles per gallon rating for 30 ca 23 21 33 41 32 40 39 20 30 37 21 30 38 191919 26 28 29 35 35 36 32 38 38 (4 pts) a. Obtain the five-number summary for the data. (The five-number summary is: Minimum, Q1, Q2, Q3, and Maximum) (1 pt) b. Use the interquartile range (IQR) rule to identify...
b d
snd e only
Elementary Jon 25 34 Problem #2 (12 points) The following data set represents the miles per gallon rating for 30 ca 23 21 33 41 32 40 39 20 30 37 21 30 38 191919 26 28 29 35 35 36 32 38 38 (4 pts) a. Obtain the five-number summary for the data. (The five-number summary is: Minimum, Q1, Q2, Q3, and Maximum) (1 pt) b. Use the interquartile range (IQR) rule to identify...
In an AM section of a statistics course there are 22 students, and in a PM...
In an AM section of a statistics course there are 22 students, and in a PM section of the course there are 30 students. The scores of a test are provided below. The results are ordered lowest to highest to aid in answering the following questions. AM: 37 50 58 59 60 61 65 66 68 68 71 75 76 76 79 82 87 88 90 92 94 95 PM: 46 48 50 52 55 60 61 61 64 65...
Name: Continuous Random Variables: Continuous Distribution Lab Collect the Data: Use a random num...
 Name: Continuous Random Variables: Continuous Distribution Lab Collect the Data: Use a random number generator to generate 50 values between 0 and 1 (inclusive). List them below. Round the numbers to 4 decimal places or set the calculator MODE to 4 places. Complete the table Calculate the following: 1t quartile Organize the Data Construct a histogram of the empirical data. 3rd quartile median Construct a histogram of the empirical data. Make 8 bars. Make 5 bars. Relative Frequency Relative Frequency...
On this worksheet, make an XY scatter plot linked to the following data: X 22 48 37 30 24 10 42 3...
On this worksheet, make an XY scatter plot linked to the following data: X 22 48 37 30 24 10 42 30 41 29 16 36 45 11 31 26 31 33 46 22 13 22 32 49 35 Y 3872 9312 5217 4230 4536 1820 8274 121 6314 3828 2448 6156 7515 1309 3534 4576 5797 4983 6670 2464 2197 3278 5408 7497 5705 Add trendline, regression equation and r squared to the plot. Add this title. ("Scatterplot of...
1) Come up with a single (one) question or problem 2) Think of an example with 30 data points a. ...
 1) Come up with a single (one) question or problem
2) Think of an example with 30 data points
a. This data needs to be of a quantitative variable
(numbers).
3) Then proceed to follow the below steps.
example of 30 quantitative data points
Purpose
State how, when, and where data was collected
List of raw data pairs
Frequency distribution (table)
Histogram
Relative percentage polygon
Sample mean
Sample median
Sample mode(s)
Sample range
Sample variance
Sample standard deviation
Coefficient of...
1) Come up with a single (one) question or problem
2) Think of an example with 30 data points
a. This data needs to be of a quantitative variable
(numbers).
3) Then proceed to follow the below steps.
example of 30 quantitative data points
Purpose
State how, when, and where data was collected
List of raw data pairs
Frequency distribution (table)
Histogram
Relative percentage polygon
Sample mean
Sample median
Sample mode(s)
Sample range
Sample variance
Sample standard deviation
Coefficient of...
Lab Exercise #15 Assignment Overview This lab exercise provides practice with Pandas data analysis library. Data...
Lab Exercise #15 Assignment Overview This lab exercise provides practice with Pandas data analysis library. Data Files We provide three comma-separated-value file, scores.csv , college_scorecard.csv, and mpg.csv. The first file is list of a few students and their exam grades. The second file includes data from 1996 through 2016 for all undergraduate degree-granting institutions of higher education. The data about the institution will help the students to make decision about the institution for their higher education such as student completion,...
 WILSM we sample, what percentagehad starting salaries of lessthan 25,000 3. For the Data sets in the test scores example, find the following a) The IQR, compare the two interquartile ranges. b). Any Outliers in either set Minimum Q1 Median Q3 Maximum 74.5 Day Night 32 25.5 56 78 82.5 89 99 98 8
 Identify potential outliers, if any, for the given data. The test scores of 15 students are listed below. 38 41 56 65 66 68 70 72 74 77 78 82 87 90 99 Steps: 1. Find Q1, Q3, and IQR 2. Find Q1 - 1.5 x IQR 3. Find Q3 +1.5 x IQR 4. Result from step 2 < Possible allowed data <Result from step 3 5. Compare step 4 to your data, find the outliers if they exist 38...
 2. Comparing smaller data sets using box plots Two data sets describing the fraction of protein recovered from thirteen test samples by each of two different methods are given in the table below Method1 Method 2 0.32 0.35 0.37 0.39 042 0.47 0.51 0.58 0.60 0.62 0.65 0.68 0.75 0.25 0.40 0.48 0.55 0.56 0.58 0.60 0.65 0.70 0.76 0.80 0.91 0.99 (a) Construct boxplots of the two sets of data. Compare the whisker lengths in the box plots of...
 Please draw boxplot
38) [6 points] The test scores of 30 students are listed below. Find the five-number summary and then draw a boxplot that represents the data. 31 41 45 48 52 55 56 56 63 65 67 67 69 70 70 74 75 78 79 79ue Ti (al 80 81 83 85 85 87 90 92 95 99 o2:M Q3: Minimum value: Q1: Maximum value: 49 TOBO 40 100 iD 30 4D
Please draw boxplot
38) [6 points] The test scores of 30 students are listed below. Find the five-number summary and then draw a boxplot that represents the data. 31 41 45 48 52 55 56 56 63 65 67 67 69 70 70 74 75 78 79 79ue Ti (al 80 81 83 85 85 87 90 92 95 99 o2:M Q3: Minimum value: Q1: Maximum value: 49 TOBO 40 100 iD 30 4D
 b d
snd e only
Elementary Jon 25 34 Problem #2 (12 points) The following data set represents the miles per gallon rating for 30 ca 23 21 33 41 32 40 39 20 30 37 21 30 38 191919 26 28 29 35 35 36 32 38 38 (4 pts) a. Obtain the five-number summary for the data. (The five-number summary is: Minimum, Q1, Q2, Q3, and Maximum) (1 pt) b. Use the interquartile range (IQR) rule to identify...
b d
snd e only
Elementary Jon 25 34 Problem #2 (12 points) The following data set represents the miles per gallon rating for 30 ca 23 21 33 41 32 40 39 20 30 37 21 30 38 191919 26 28 29 35 35 36 32 38 38 (4 pts) a. Obtain the five-number summary for the data. (The five-number summary is: Minimum, Q1, Q2, Q3, and Maximum) (1 pt) b. Use the interquartile range (IQR) rule to identify...
 Name: Continuous Random Variables: Continuous Distribution Lab Collect the Data: Use a random number generator to generate 50 values between 0 and 1 (inclusive). List them below. Round the numbers to 4 decimal places or set the calculator MODE to 4 places. Complete the table Calculate the following: 1t quartile Organize the Data Construct a histogram of the empirical data. 3rd quartile median Construct a histogram of the empirical data. Make 8 bars. Make 5 bars. Relative Frequency Relative Frequency...
 1) Come up with a single (one) question or problem
2) Think of an example with 30 data points
a. This data needs to be of a quantitative variable
(numbers).
3) Then proceed to follow the below steps.
example of 30 quantitative data points
Purpose
State how, when, and where data was collected
List of raw data pairs
Frequency distribution (table)
Histogram
Relative percentage polygon
Sample mean
Sample median
Sample mode(s)
Sample range
Sample variance
Sample standard deviation
Coefficient of...
1) Come up with a single (one) question or problem
2) Think of an example with 30 data points
a. This data needs to be of a quantitative variable
(numbers).
3) Then proceed to follow the below steps.
example of 30 quantitative data points
Purpose
State how, when, and where data was collected
List of raw data pairs
Frequency distribution (table)
Histogram
Relative percentage polygon
Sample mean
Sample median
Sample mode(s)
Sample range
Sample variance
Sample standard deviation
Coefficient of...
Most questions answered within 3 hours.
-
which reagent CAN convert the glucose ring into a linear
chain?
a) HCl (aq)
b) H2CrO4...
asked 5 minutes ago -
USING MATLAB.
Design a program which uses a for…end loop to add 10 to
a variable...
asked 6 minutes ago -
The raft is made up of
ten 18 cm diameter logs, each with a length of...
asked 9 minutes ago -
Batteries are one of the major imports of the US from China.
Batteries cost 10 Yuan...
asked 25 minutes ago -
the
Kb of ammonia (NH3) at 25.0 C is 1.75 x 10⁻⁵. Calculate the pH of...
asked 32 minutes ago -
aluminum maker Alcoa has a beta of about 1.86, whereas Hormel
Foods has a beta of...
asked 42 minutes ago -
Hewtex Electronics manufactures two products, headsets and
electronic calculators, and sells them nationally to wholesalers
and...
asked 45 minutes ago -
PHP
Create an HTML Form that asks for a series of
personal information from the user,...
asked 36 minutes ago -
The cash account for American Medical Co. at April 30 indicated
a balance of $10,785. The...
asked 41 minutes ago -
Describe how to measure benefits, including specific examples of
clinical and financial benefits that can be...
asked 58 minutes ago -
Costs associated with the manufacture of miniature
high-sensitivity piezoresistive pressure transducers is $74,000 per
year. A...
asked 1 hour ago -
Given the following information for Jane Cole complete schedule
D of 1040 through part III and...
asked 1 hour ago