
Homework Answers
Add Answer to:
A cellular phone company monitors monthly phone usage. The following data represent the monthly phone use...
A cellular phone company monitors monthly phone usage. The following data represent the monthly phone use...
 A cellular phone company monitors monthly phone usage. The following data represent the monthly phone use in minutes of 334 499 347 379 389 one particular customer for the past 20 months. Use the given data to answer parts (a) and (b). 395 524 373 331 509 332 487 491 466 441 519 501 359 478 403 sts (a) Determine the standard deviation and interquartile range of the data. (Round to two decimal places as needed) IQR(Type an integer or...
A cellular phone company monitors monthly phone usage. The following data represent the monthly phone use in minutes of one particular customer for the past 20 months. Use the given data to answer pa...
 A cellular phone company monitors monthly phone usage. The following data represent the monthly phone use in minutes of one particular customer for the past 20 months. Use the given data to answer parts (a) and (b). $$ \begin{array}{lllll} 328 & 346 & 371 & 455 & 325 \\ \hline 417 & 451 & 498 & 344 & 320 \\ \hline 476 & 549 & 438 & 462 & 353 \\ \hline 545 & 432 & 460 & 552 & 478...
A cellular phone company monitors monthly phone usage. The following data represent the monthly phone use...
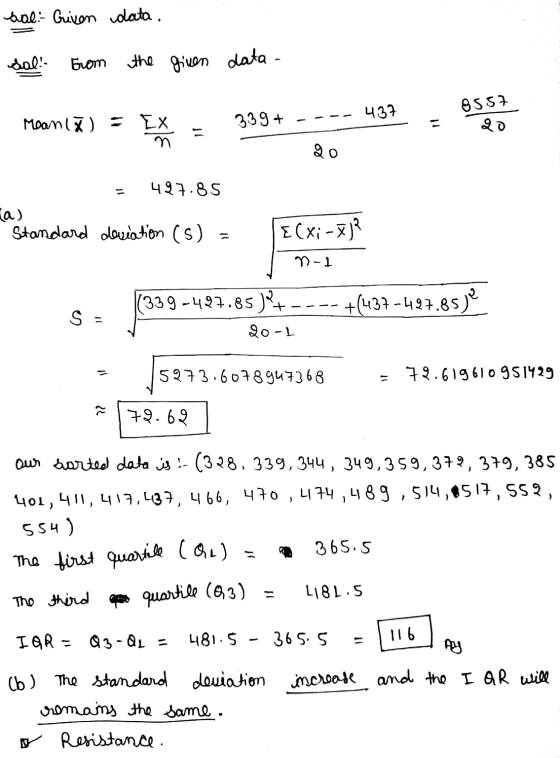
 A cellular phone company monitors monthly phone usage. The following data represent the monthly phone use in minutes of one particular customer for the past 20 months. Use the given data to answer parts (a) and (b). 339 456 425 478 549 556 505 544 446 472 449 521 545 445 468 367 431 394 408 496 (a) Determine the standard deviation and interquartile range of the data Sul (Round to two decimal places as needed.)
U A cellular phone company monitors monthly phone usage. The following data represent the monthly phone...
 U A cellular phone company monitors monthly phone usage. The following data represent the monthly phone use in minutes of one particular customer for the past 20 months. Use the given data to answer parts (a) and (b). 331 377 436 480 500 330 497 441 343 529 495 342 389 474 363 415 521 329 496 442 S (a) Determine the standard deviation and interquartile range of the data. (Round to two decimal places as needed.) IQR-(Type an integer...
Use the numbers under the first pic instead of the ones on the first screen. please...
 Use the numbers under the first pic instead of the ones on the
first screen. please and thanks.
A cellular phone company monitors monthly phone usage. The following data represent the monthly phone use in minutes of one particular customer for the past 20 months. Use the given data to answer parts (a) and (b). 330 439 543 432 389 335 499 488 498 418 493 420 529 481 480 545 483 526 513 547 (a) Determine the standard deviation...
Use the numbers under the first pic instead of the ones on the
first screen. please and thanks.
A cellular phone company monitors monthly phone usage. The following data represent the monthly phone use in minutes of one particular customer for the past 20 months. Use the given data to answer parts (a) and (b). 330 439 543 432 389 335 499 488 498 418 493 420 529 481 480 545 483 526 513 547 (a) Determine the standard deviation...
4). a.b. The weight of an organ in adult males has a bell-shaped distribution with a...
 4).
a.b.
The weight of an organ in adult males has a bell-shaped distribution with a mean of 325 grams and a standard deviation of 20 grams. Use the empirical rule to determine the following. (a) About 99.7% of organs will be between what weights? (b) What percentage of organs weighs between 305 grams and 345 grams? (c) What percentage of organs weighs less than 305 grams or more than 345 grams? (d) What percentage of organs weighs between 285...
4).
a.b.
The weight of an organ in adult males has a bell-shaped distribution with a mean of 325 grams and a standard deviation of 20 grams. Use the empirical rule to determine the following. (a) About 99.7% of organs will be between what weights? (b) What percentage of organs weighs between 305 grams and 345 grams? (c) What percentage of organs weighs less than 305 grams or more than 345 grams? (d) What percentage of organs weighs between 285...
A national survey asked people, "How often do you eat out for dinner. (a) Construct a...
 A national survey asked people, "How often do you eat out for dinner. (a) Construct a relative frequency distribution of the data. instead of at home?" The frequencies were as follows. Complete parts (a) through (9) Relative Response Frequency Never Response Frequency Rarely Never 252 Sometimes Rarely 569 Most of the time Sometimes 966 Most of the time Always 371 Always (Round to three decimal places as needed.) 68 (b) What percentage of respondents answered "Always"? (Round to one decimal...
HW Score: 78.69%, 12.59 of 16 pts Score: 0 of 1 pt 8 of 16 (15 complete) 3.4.25 Question Help * The following data represent the monthly phone use, n minutes, a customer en ed in a aud prevention pro...
 HW Score: 78.69%, 12.59 of 16 pts Score: 0 of 1 pt 8 of 16 (15 complete) 3.4.25 Question Help * The following data represent the monthly phone use, n minutes, a customer en ed in a aud prevention pro ram for the past 20 months. The phone c point for the number of minutes at which the customer should be contacted. What is the cutoff point? des touse the upper ence as the cutoff 386 510 449 522 ryde...
Use the following information to answer the questions below: Heat Power is a utility company that...
 Use the following information to answer the questions below: Heat Power is a utility company that would like to predict the monthly heating bill for a household in a particular region during the month of January. A random sample of 18 households in the region were selected and their January heating bill recorded. The data is shown in the table below along with the square footage of the house (SF), the age of the heating system in years (Age), and...
 A cellular phone company monitors monthly phone usage. The following data represent the monthly phone use in minutes of 334 499 347 379 389 one particular customer for the past 20 months. Use the given data to answer parts (a) and (b). 395 524 373 331 509 332 487 491 466 441 519 501 359 478 403 sts (a) Determine the standard deviation and interquartile range of the data. (Round to two decimal places as needed) IQR(Type an integer or...
 A cellular phone company monitors monthly phone usage. The following data represent the monthly phone use in minutes of one particular customer for the past 20 months. Use the given data to answer parts (a) and (b). $$ \begin{array}{lllll} 328 & 346 & 371 & 455 & 325 \\ \hline 417 & 451 & 498 & 344 & 320 \\ \hline 476 & 549 & 438 & 462 & 353 \\ \hline 545 & 432 & 460 & 552 & 478...
 A cellular phone company monitors monthly phone usage. The following data represent the monthly phone use in minutes of one particular customer for the past 20 months. Use the given data to answer parts (a) and (b). 339 456 425 478 549 556 505 544 446 472 449 521 545 445 468 367 431 394 408 496 (a) Determine the standard deviation and interquartile range of the data Sul (Round to two decimal places as needed.)
 U A cellular phone company monitors monthly phone usage. The following data represent the monthly phone use in minutes of one particular customer for the past 20 months. Use the given data to answer parts (a) and (b). 331 377 436 480 500 330 497 441 343 529 495 342 389 474 363 415 521 329 496 442 S (a) Determine the standard deviation and interquartile range of the data. (Round to two decimal places as needed.) IQR-(Type an integer...
 Use the numbers under the first pic instead of the ones on the
first screen. please and thanks.
A cellular phone company monitors monthly phone usage. The following data represent the monthly phone use in minutes of one particular customer for the past 20 months. Use the given data to answer parts (a) and (b). 330 439 543 432 389 335 499 488 498 418 493 420 529 481 480 545 483 526 513 547 (a) Determine the standard deviation...
Use the numbers under the first pic instead of the ones on the
first screen. please and thanks.
A cellular phone company monitors monthly phone usage. The following data represent the monthly phone use in minutes of one particular customer for the past 20 months. Use the given data to answer parts (a) and (b). 330 439 543 432 389 335 499 488 498 418 493 420 529 481 480 545 483 526 513 547 (a) Determine the standard deviation...
 4).
a.b.
The weight of an organ in adult males has a bell-shaped distribution with a mean of 325 grams and a standard deviation of 20 grams. Use the empirical rule to determine the following. (a) About 99.7% of organs will be between what weights? (b) What percentage of organs weighs between 305 grams and 345 grams? (c) What percentage of organs weighs less than 305 grams or more than 345 grams? (d) What percentage of organs weighs between 285...
4).
a.b.
The weight of an organ in adult males has a bell-shaped distribution with a mean of 325 grams and a standard deviation of 20 grams. Use the empirical rule to determine the following. (a) About 99.7% of organs will be between what weights? (b) What percentage of organs weighs between 305 grams and 345 grams? (c) What percentage of organs weighs less than 305 grams or more than 345 grams? (d) What percentage of organs weighs between 285...
 A national survey asked people, "How often do you eat out for dinner. (a) Construct a relative frequency distribution of the data. instead of at home?" The frequencies were as follows. Complete parts (a) through (9) Relative Response Frequency Never Response Frequency Rarely Never 252 Sometimes Rarely 569 Most of the time Sometimes 966 Most of the time Always 371 Always (Round to three decimal places as needed.) 68 (b) What percentage of respondents answered "Always"? (Round to one decimal...
 HW Score: 78.69%, 12.59 of 16 pts Score: 0 of 1 pt 8 of 16 (15 complete) 3.4.25 Question Help * The following data represent the monthly phone use, n minutes, a customer en ed in a aud prevention pro ram for the past 20 months. The phone c point for the number of minutes at which the customer should be contacted. What is the cutoff point? des touse the upper ence as the cutoff 386 510 449 522 ryde...
 Use the following information to answer the questions below: Heat Power is a utility company that would like to predict the monthly heating bill for a household in a particular region during the month of January. A random sample of 18 households in the region were selected and their January heating bill recorded. The data is shown in the table below along with the square footage of the house (SF), the age of the heating system in years (Age), and...
 Use the following information to answer the questions below: Heat Power is a utility company that would like to predict the monthly heating bill for a household in a particular region during the month of January. A random sample of 18 households in the region were selected and their January heating bill recorded. The data is shown in the table below along with the square footage of the house (SF), the age of the heating system in years (Age), and...
Most questions answered within 3 hours.
-
calculate the number of molecules of gas in a
container of 2.0 liter at 30 degrees...
asked 14 minutes ago -
1.which of the following is a phototroph?
a. sulfolobus
b. chloroflexus
c. bacteroidetes
d. deinococcus radioduran...
asked 10 minutes ago -
The group of companies LC "High-precision measuring instruments"
is the global provider of measurement, analysis and...
asked 16 minutes ago -
I want to write a python function to find the minimum
I have an nested list:...
asked 16 minutes ago -
Convert the high level language programming statementts to 80x86
assembly, Assume X=AX and y=BX
for (i=1;...
asked 25 minutes ago -
SoleMate’s Burkins sneakers cost $40 per pair from the supplier
and are sold by SoleMate at...
asked 29 minutes ago -
The movie Moneyball (based on the book by Michael
Lewis) tells the story of Billy Beane,...
asked 29 minutes ago -
A regional highway uses 8 tollbooths that are open to all
vehicles. A chi-square goodness-of-fit test...
asked 32 minutes ago -
In her Semiannual Monetary Policy Report to Congress on July 13,
2017, then Federal Reserve Chair...
asked 31 minutes ago -
Suppose N packets are sent,
and each packet arrives at rate of L/2R to a link....
asked 50 minutes ago -
17. Show the steps involved in reduction of the ketone in fatty
acid synthesis. Which cofactor...
asked 51 minutes ago -
5.61 g of octane, C8H18, reacts with excess oxygen in a bomb
calorimeter. The heat capacity...
asked 55 minutes ago