
Homework Answers
Correlation:
1. The researcher will expect a negative relationship between years driving experience and insurance premium
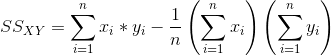
2. Sum of squares and cross products: 
3. Correlation coefficient r=-0.7608. The coefficient of
determination 
4.The percentage of variation in monthly insurance premiums that is attributable to years driving experience=57.89%
5. The hypothesis test indicates that correlation exists between years driving experience and the insurance premium(t=6.9354, critical t=2.0301).
Regression:
1. Slope for BLR: 

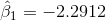
2. y-intercept : 


3. The equation for the linear model: premium=86.7619-2.2912*years driving
4. For a person with 10 years experience the premium= 86.7619-2.2912*10
=63.8499
5. The standard error estimate =12.1045
6. The standard error of b1=0.3303
7. The test statistic :  . The critical value is 2.03010. Since the
  , we reject the null hypothesis and conclude that the regression
slope cannot be assumed to be zero.
, we reject the null hypothesis and conclude that the regression
slope cannot be assumed to be zero.
8. 95% confidence interval for b1, 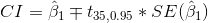


----------------------------------------------------Calculations-------------------------------------------------------------------------------------------


Correlation coefficient 


5. Null hypothesis of correlation test:


Test statistic:  will be distributed as a t with 37-2=35 df.


The critical value of t at 35 df at 5% level is 2.0301. Since, t calculated value >the critical value , we reject the null hypotesis and conclude that the correlation is significant and cannot be assumed to be 0.
5. The regression sum of squares: 

Total sum of squares : 
Error SS ESS=SST-SSR=5128.1439
Mean square error=5128.1439/35=146.5184
Therefore the standard error =
6. Standard error of b1: 

7. Test statistic:
Add Answer to:
Assignment 10 1. A random sample of 37 drivers insured with a company having similar auto...
A random sample of eight auto drivers insured with a company and having similar auto insurance...
A random sample of eight auto drivers insured with a company and having similar auto insurance policies was selected. The following table lists their driving experience (in years) and the monthly auto insurance premium (in dollars). Driving Experience(years) 5 2 12 9 15 6 25 16 Monthly Premium(dollars) 64 87 50 71 44 56 42 60 Answer the following questions. (h) What is the value of the correlation coefficient, r? Is the linear relationship between the price and the age...
A random sample of eight auto drivers insured with a company and having similar auto insurance policies was selected. The following table lists their driving experience (in years) and the monthly auto...
A random sample of eight auto drivers insured with a company and having similar auto insurance policies was selected. The following table lists their driving experience (in years) and the monthly auto insurance premium (in dollars). Driving Experience(years) 5 2 12 9 15 6 25 16 Monthly Premium(dollars) 64 87 50 71 44 56 42 60 Answer the following questions. (a) Does the insurance premium depend on driving experience or does the driving experience depend on insurance premium? Do you...
Most questions answered within 3 hours.
-
A sine wave signal is displayed on the screen of an
oscilloscope. 6 peak-to-peak divisions are...
asked 1 hour ago -
a
1500 kg car accelerates from 0 to 25 m / s in 21.0s. How much...
asked 2 hours ago -
Calculate the molarity of each of the following solutions:
(a) 30.5 g of ethanol (C2H5OH) in...
asked 2 hours ago -
1 Refer to the build-borrow-or-buy framework as a decision tree
for the Adidas company. Identify a...
asked 3 hours ago -
Problem 2: The Problem of Social Cost. A Rancher and Farmer live
side-by-side to each other....
asked 4 hours ago -
a uniform bar of weight 40N is 4 meter long. weights
on 60N and 100N are...
asked 4 hours ago -
Define Diet counceling? What are the
responsibilities of a counselor?
asked 6 hours ago -
Hey im just confused about how to put the ' A angle n' and ' S...
asked 6 hours ago -
A short essay about the WSJ article on Oreo versus Hydrox.
asked 6 hours ago -
##8. A program contains the following function definition:
##def cube(num):
##return num * num * num...
asked 6 hours ago -
find the value z of a standard Normal variable that satisfies
each of the given conditions....
asked 6 hours ago -
"banana".find('z')
Out[22]: -1
why is this -1
python 3.7
asked 6 hours ago