Please help me with this one
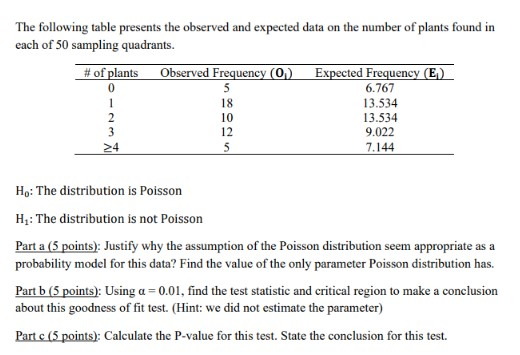
The following table presents the observed and expected data on the number of plants found in each of 50 sampling quadrants. # of plants Observed Frequency (0) Expected Frequency (E) 5 6.767 18 13.534 2 10 13.534 3 12 9.022 24 5 7.144 Ho: The distribution is Poisson Hy: The distribution is not Poisson Part a (5 points): Justify why the assumption of the Poisson distribution seem appropriate as a probability model for this data? Find the value of the only parameter Poisson distribution has. Part b (5 points): Using a =0.01, find the test statistic and critical region to make a conclusion about this goodness of fit test. (Hint: we did not estimate the parameter) Part c (5 points): Calculate the P-value for this test. State the conclusion for this test.
Homework Answers
a) Since the random variable is the number of plants found in each of the sampling quadrants, and the number of plants will always be a discrete value, hence, the Poisson's distribution will be an appropriate model for this data.
From the data, we can see that the expected number of sampling quadrants with no plants is = 6.767.
The hypothesized probability that a sampling quadrant will have no plants is = 6.767/50 = 0.135
If  is our parameter for the Poisson's distribution, then the
probability of having no plant in sampling quadrant will be
is our parameter for the Poisson's distribution, then the
probability of having no plant in sampling quadrant will be

Now, as calculated above, we have


Hence, the value of the Poisson distribution parameter is = 2.
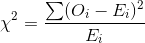
b) The value of the chi-squared test statistics is


The critical chi-sqaured value for a degree of freedom of 4 and a significance level of 0.01 is = 13.277
Hence, the critical region will be the region to the right of the chi-sqaure value of 13.277, that is, if the chi-squared value is less than the critical value then we will accept the null hypothesis.
C. The p-value corresponding to a chi-sqaured statistics of 4.484 and a degree of freedom of 4 is = 0.344.
The significance level is = 0.01.
Since the p-value is greater than the significance level, hence we will fail to reject the null hypothesis.
Conclusion: The null hypothesis is true and there is not enough evidence to conclude that the data doesn't follow a Poisson distribution.
Thank You!! Please Upvote!!
Add Answer to:
Please help me with this one
The following table presents the observed and expected data on...
The following table presents the observed and expected data on the number of plants found in...
 The following table presents the observed and expected data on the number of plants found in each of 50 sampling quadrants. # of plants Observed Frequency (0) Expected Frequency (E) 5 6.767 18 13.534 2 10 13.534 3 12 9.022 24 5 7.144 Ho: The distribution is Poisson Hy: The distribution is not Poisson Part a (5 points): Justify why the assumption of the Poisson distribution seem appropriate as a probability model for this data? Find the value of the...
The following table presents the observed and expected data on the number of plants found in...
 The following table presents the observed and expected data on the number of plants found in each of 50 sampling quadrants. # of plants 0 Observed Frequency (0) 5 18 10 1 Expected Frequency (E;) 6.767 13.534 13.534 9.022 7.144 2 3 >4 12 5 Ho: The distribution is Poisson H7: The distribution is not Poisson A) Justify why the assumption of the Poisson distribution seem appropriate as a probability model for this data? Find the value of the only...
The following table presents the observed and expected data on the number of plants found in...
 The following table presents the observed and expected data on the number of plants found in each of 50 sampling quadrants. # of plants 0 1 2 Observed Frequency (0) 5 18 10 12 5 Expected Frequency (E) 6.767 13.534 13.534 9.022 7.144 24 Ho: The distribution is Poisson H : The distribution is not Poisson Part b (5 points): Using a = 0.01, find the test statistic and critical region to make a conclusion about this goodness of fit...
show work The following table presents the observed and expected data on the number of plants...
 show work
The following table presents the observed and expected data on the number of plants found in each of 50 sampling quadrants. # of plants Observed Frequency (0) Expected Frequency (E) 0 5 6.767 18 13.534 2 10 13.534 3 12 9.022 5 7.144 24 Ho: The distribution is Poisson H: The distribution is not Poisson Part a (5 points): Justify why the assumption of the Poisson distribution seem appropriate as a probability model for this data? Find the...
show work
The following table presents the observed and expected data on the number of plants found in each of 50 sampling quadrants. # of plants Observed Frequency (0) Expected Frequency (E) 0 5 6.767 18 13.534 2 10 13.534 3 12 9.022 5 7.144 24 Ho: The distribution is Poisson H: The distribution is not Poisson Part a (5 points): Justify why the assumption of the Poisson distribution seem appropriate as a probability model for this data? Find the...
The following table presents the observed and expected data on the number of plants found in...
 The following table presents the observed and expected data on
the number of plants found in each of 50 sampling quadrants.
# of plants
Observed Frequency (Oi)
Expected Frequency (Ei)
0
5
6.676
1
18
13.534
2
10
13.534
3
12
9.022
4
5
7.144
H0 : The distribution is Poisson
H1 : The distribution is not Poisson
a.) Justify why the assumption of the Poisson distribution seem
appropriate as a probability model for this data? Find the value of...
The following table presents the observed and expected data on
the number of plants found in each of 50 sampling quadrants.
# of plants
Observed Frequency (Oi)
Expected Frequency (Ei)
0
5
6.676
1
18
13.534
2
10
13.534
3
12
9.022
4
5
7.144
H0 : The distribution is Poisson
H1 : The distribution is not Poisson
a.) Justify why the assumption of the Poisson distribution seem
appropriate as a probability model for this data? Find the value of...
Question 1 of 4 For the following observed and expected frequencies: Observed 39 43 42 109 Expected 38 48 45 S 6 Download data Test the hypothesis that the distribution of the observed fr...
 Question 1 of 4 For the following observed and expected frequencies: Observed 39 43 42 109 Expected 38 48 45 S 6 Download data Test the hypothesis that the distribution of the observed frequencies is as given by the expected frequencies. Use thea -0.025 level of significance and theP-value method with the TI-84 calculator Part 1 State the null and alternate hypotheses. Ho: The distribution of the observed frequencies ts H1: The distribution of the observed frequencies differs from that...
Consider the following frequency table of observations on the random variable X. Values 0 1 2...
Consider the following frequency table of observations on the random variable X. Values 0 1 2 3 4 5 Observed Frequency 8 25 22 21 16 8 (a) Based on these 100 observations, is a Poisson distribution with a mean of 2.4 an appropriate model? Perform a goodness-of-fit procedure with α=0.05. Which of the following is the correct conclusion? (b) Which of the following are the correct bounds on the P-value for this test.
11. The following 30 datapoints were generated from one of our discrete distributions. 8, 12,7,7,7,12,1,5,1,5,6,5,4,7,3,3,9,4,5,4,8,9,3,6,8,4,7, 4,...
 11. The following 30 datapoints were generated from one of our discrete distributions. 8, 12,7,7,7,12,1,5,1,5,6,5,4,7,3,3,9,4,5,4,8,9,3,6,8,4,7, 4, 11,8 In this problem, we will use various x2 tests to try to figure out which distribution it was. (a) If the data was generated by a uniform distribution from m to n, what are the most likely choice of the parameters m, n? The most likely uniform distribution is given by [1, 12]. Anything else would have lower probability. (b) Use a x?...
Descriptive Statistics Mean Std. Deviation Minimum 2.02. 8201 Maximum Type.netish Type of Fish Observed N Expected...
 Descriptive Statistics Mean Std. Deviation Minimum 2.02. 8201 Maximum Type.netish Type of Fish Observed N Expected N Residual Atlantic Cod 16.7 Acadian Redfish 16.7 Atlantic Lobster +16.7 Total Test Statistics Type of Fish Chi-Square 040- Asyme. Sig. 980 a. O cells (0,0%) have expected frequencies less than 5. The minimum expected cell frequency is 16.7. (Ctrl) - For this assignment, you will use the chi-square goodness of fit test to determine if the proportion of fish species in one location...
The data in the Tollowing table are the frequency counts for 40o observations on the number of bacterial colonies within the field of a microscope, using samples of milk film. Is there sufficient...
 The data in the Tollowing table are the frequency counts for 40o observations on the number of bacterial colonies within the field of a microscope, using samples of milk film. Is there sufficient evidence to claim that the data do not fit the Poisson distribution? (Use a-0.05.) State the null and alternative hypotheses. O My The data fit a Poisson distribution. The data do not fit a Poisson dstribution. O Mo The data do not fit a Poisson distribution. The...
 The following table presents the observed and expected data on the number of plants found in each of 50 sampling quadrants. # of plants Observed Frequency (0) Expected Frequency (E) 5 6.767 18 13.534 2 10 13.534 3 12 9.022 24 5 7.144 Ho: The distribution is Poisson Hy: The distribution is not Poisson Part a (5 points): Justify why the assumption of the Poisson distribution seem appropriate as a probability model for this data? Find the value of the...
 The following table presents the observed and expected data on the number of plants found in each of 50 sampling quadrants. # of plants 0 Observed Frequency (0) 5 18 10 1 Expected Frequency (E;) 6.767 13.534 13.534 9.022 7.144 2 3 >4 12 5 Ho: The distribution is Poisson H7: The distribution is not Poisson A) Justify why the assumption of the Poisson distribution seem appropriate as a probability model for this data? Find the value of the only...
 The following table presents the observed and expected data on the number of plants found in each of 50 sampling quadrants. # of plants 0 1 2 Observed Frequency (0) 5 18 10 12 5 Expected Frequency (E) 6.767 13.534 13.534 9.022 7.144 24 Ho: The distribution is Poisson H : The distribution is not Poisson Part b (5 points): Using a = 0.01, find the test statistic and critical region to make a conclusion about this goodness of fit...
 show work
The following table presents the observed and expected data on the number of plants found in each of 50 sampling quadrants. # of plants Observed Frequency (0) Expected Frequency (E) 0 5 6.767 18 13.534 2 10 13.534 3 12 9.022 5 7.144 24 Ho: The distribution is Poisson H: The distribution is not Poisson Part a (5 points): Justify why the assumption of the Poisson distribution seem appropriate as a probability model for this data? Find the...
show work
The following table presents the observed and expected data on the number of plants found in each of 50 sampling quadrants. # of plants Observed Frequency (0) Expected Frequency (E) 0 5 6.767 18 13.534 2 10 13.534 3 12 9.022 5 7.144 24 Ho: The distribution is Poisson H: The distribution is not Poisson Part a (5 points): Justify why the assumption of the Poisson distribution seem appropriate as a probability model for this data? Find the...
 The following table presents the observed and expected data on
the number of plants found in each of 50 sampling quadrants.
# of plants
Observed Frequency (Oi)
Expected Frequency (Ei)
0
5
6.676
1
18
13.534
2
10
13.534
3
12
9.022
4
5
7.144
H0 : The distribution is Poisson
H1 : The distribution is not Poisson
a.) Justify why the assumption of the Poisson distribution seem
appropriate as a probability model for this data? Find the value of...
The following table presents the observed and expected data on
the number of plants found in each of 50 sampling quadrants.
# of plants
Observed Frequency (Oi)
Expected Frequency (Ei)
0
5
6.676
1
18
13.534
2
10
13.534
3
12
9.022
4
5
7.144
H0 : The distribution is Poisson
H1 : The distribution is not Poisson
a.) Justify why the assumption of the Poisson distribution seem
appropriate as a probability model for this data? Find the value of...
 Question 1 of 4 For the following observed and expected frequencies: Observed 39 43 42 109 Expected 38 48 45 S 6 Download data Test the hypothesis that the distribution of the observed frequencies is as given by the expected frequencies. Use thea -0.025 level of significance and theP-value method with the TI-84 calculator Part 1 State the null and alternate hypotheses. Ho: The distribution of the observed frequencies ts H1: The distribution of the observed frequencies differs from that...
 11. The following 30 datapoints were generated from one of our discrete distributions. 8, 12,7,7,7,12,1,5,1,5,6,5,4,7,3,3,9,4,5,4,8,9,3,6,8,4,7, 4, 11,8 In this problem, we will use various x2 tests to try to figure out which distribution it was. (a) If the data was generated by a uniform distribution from m to n, what are the most likely choice of the parameters m, n? The most likely uniform distribution is given by [1, 12]. Anything else would have lower probability. (b) Use a x?...
 Descriptive Statistics Mean Std. Deviation Minimum 2.02. 8201 Maximum Type.netish Type of Fish Observed N Expected N Residual Atlantic Cod 16.7 Acadian Redfish 16.7 Atlantic Lobster +16.7 Total Test Statistics Type of Fish Chi-Square 040- Asyme. Sig. 980 a. O cells (0,0%) have expected frequencies less than 5. The minimum expected cell frequency is 16.7. (Ctrl) - For this assignment, you will use the chi-square goodness of fit test to determine if the proportion of fish species in one location...
 The data in the Tollowing table are the frequency counts for 40o observations on the number of bacterial colonies within the field of a microscope, using samples of milk film. Is there sufficient evidence to claim that the data do not fit the Poisson distribution? (Use a-0.05.) State the null and alternative hypotheses. O My The data fit a Poisson distribution. The data do not fit a Poisson dstribution. O Mo The data do not fit a Poisson distribution. The...
Most questions answered within 3 hours.
-
A bicyclist starting at rest produces a constant angular
acceleration of 1.10 rad/s2 for wheels that...
asked 8 minutes ago -
The
half-life of a radioactive source is 14.0 minutes. How much time
must elapse before the...
asked 6 minutes ago -
Given P(Ec ) = 0.43, P(F) = 0.52, and P(EF) = 0.18.
Find P( E |...
asked 53 minutes ago -
Consider two empty containers A and B whose volumes are
10mL and 20mL respectively. 1mL of...
asked 56 minutes ago -
QUESTION 6
Determine the linear momentum of a 2,800 kg houseboat going 3
m/s.
9,100 kg.m/s...
asked 1 hour ago -
Jor-el throws a ball upward from the top of a 728 foot building
on the planet...
asked 1 hour ago -
Which of the following will most likely to happen if Federal
Reserve Bank decreases the money...
asked 57 minutes ago -
You’ve just joined the investment banking firm of Dewey,
Cheatum, and Howe. They’ve offered you two...
asked 51 minutes ago -
An air conditioner cools 226 m^3/min of humid air at 36 oC and
98% relative humidity...
asked 50 minutes ago -
Vaughn Manufacturing acquires a coal mine at a cost of $1870000.
Intangible development costs total $354000....
asked 1 hour ago -
Question 5
What effect would a decrease in
temperature have on pressure, assuming that volume
(T)...
asked 1 hour ago -
Draw the Lewis dot structures for the following molecules. None
of the atoms have a formal...
asked 1 hour ago