
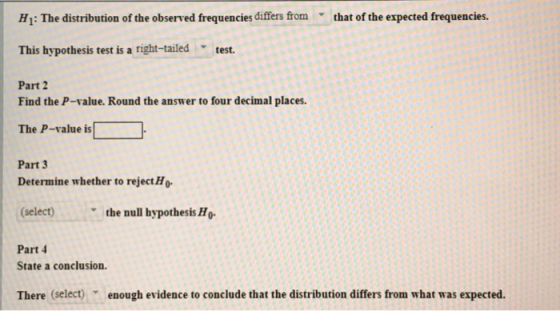


Hi: The distribution of the observed frequencies differs from that of the expected frequencies. This hypothesis test is a right-tailed est. Part 2 Find the P-value. Round the answer to four decimal places. The P-value is Part 3 Determine whether to reject Ho (select) the null hypothesis Ho Part 4 State a conclusion. There (select) ▼ enough evidence to conclude that the distribution differs from what was expected.
Following are observed frequencies. The null hypothesis is H0: P1-0.20,P2 = 0.25,P3-0.10,P4-0.30,p5-0.15 Category |12345 Observed 38 33 21 31 27 Download data Test the hypothesis that the distribution of the observed frequencies is as given by the null hypothesis. Use the 0.05 level of significance and thP -value method with the TI-84 calculator Part 1 State the null and alternate hypotheses. Ho: P1-0.20,P2-ㄈㄧㄧㄧ-P3-ㄈㄧ囗,P4-0.30,p5-0.15
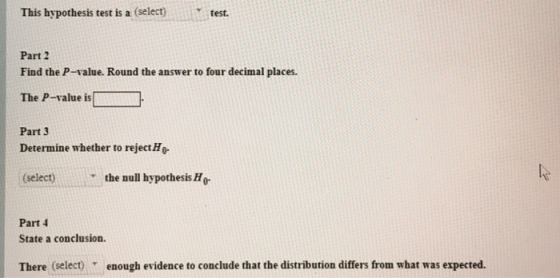
This hypothesis test is a (select)test Part 2 Find the P-value. Round the answer to four decimal places. The P-value is□ー□. Part 3 Determine whether to reject Ho- the null hypothesis Ho- (select) Part 4 State a conclusion. enough evidence to conclude that the distribution differs from what was expected. There (select)
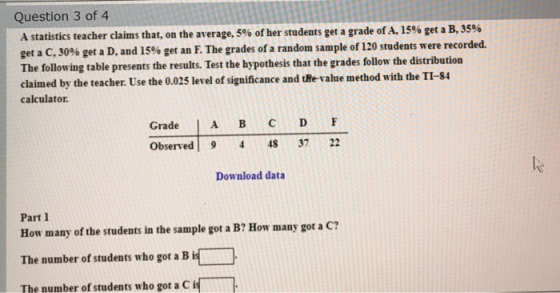
Question 3 of 4 A statistics teacher claims that, on the average, 5% of her students get a grade of A, 15% get a B, 35% get a C, 30% get a D, and 15% get an F. The grades of a random sample of 120 students were recorded. The following table presents the results. Test the hypothesis that the grades follow the distribution claimed by the teacher. Use the 0.025 level of significance and tRe-value method with the TI-84 calculator. Grade A B D F Observed 9 448 37 22 Download data Part 1 How many of the students in the sample got a B? How many got a C? The number of students who got a Bi The number of students who got a C i
Part 2 State the null and alternate hypotheses. H1: Some or all of the actual probabilities (select)from those specified byHo test This hypothesis test is a (select) Part 3 Find the P-value. Round the answer to four decimal places. The P-value is Part 4 Determine whether to reject Ho (select) wthe null hypothesis Ho
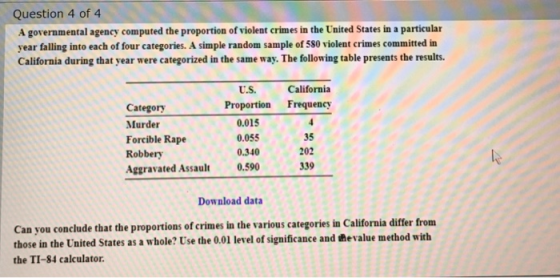
Question 4 of 4 A governmental agency computed the proportion of violent crimes in the United States in a particular year falling into each of four categories. A simple random sample of 580 violent crimes committed in California during that year were categorized in the same way. The following table presents the results U.S. California Proportion Frequency Category Murder Forcible Rape Robbery Aggravated Assault0.590 0.015 0.055 0.340 35 202 339 Download data Can you conclude that the proportions of crimes in the various categories in California differ from those in the United States as a whole? Use the 0.01 level of significance and Revalue method with the TI-84 calculator
Part 1 State the null and alternate hypotheses. Ho: The proportions of crimes in the various categories in Californial(select) the same as those in the United States as a whole. the same as those in Hi : The proportions of crimes in the various categories in California(select) the United States as a whole. This hypothesis test is a (select)test. Part 2 Find the P-value. Round the answer to four decimal places The P-value is Part 3 Determine whether to reject Ho
Part 4 State a conclusion. There (select) enough evidence to conclude that the various categories in California differ from those in the United States as a whole pyright 2019 The McGraw-Hill Companies
Homework Answers
Q1 1. Null and alternative hypothesis:
Ho: The distribution of the observed frequencies is equal to that of the expected frequencies
H1: The distribution of the observed frequencies differs from that of the expected frequencies
This is a right tailed test.
2. Test statistic:
χ² = ∑ ((O-E)²/E) = 0.0263 + 0.5208+0.2+0.5+1.5 = 2.7471
df = 5-1 =4
p-value = CHISQ.DIST.RT(2.7471, 4) =0.6010
3. Fail to reject the null hypothesis Ho.
4. There is not enough evidence to conclude.
----------------------------------
Q2: 1. Null and alternative hypothesis:
H0:p1=0.20,p2=0.25,p3=0.10,p4=0.30,p5=0.15
This is a right tailed test.
2.
The following table is obtained:
| Categories | Observed | Expected | (fo-fe)2/fe |
| 1 | 38 | 150*0.20=30 | (38-30)2/30 = 2.133 |
| 2 | 33 | 150*0.25=37.5 | (33-37.5)2/37.5 = 0.54 |
| 3 | 21 | 150*0.10=15 | (21-15)2/15 = 2.4 |
| 4 | 31 | 150*0.30=45 | (31-45)2/45 = 4.356 |
| 5 | 27 | 150*0.15=22.5 | (27-22.5)2/22.5 = 0.9 |
| Sum = | 150 | 150 | 10.329 |
χ² = ∑ ((O-E)²/E) = 2.133+ 0.54+2.4+4.356+0.9 = 10.329
df = 5-1 =4
p-value = CHISQ.DIST.RT(10.329, 4) =0.0352
3. Reject the null hypothesis Ho.
4. There is enough evidence to conclude.
---------------------------------------
Q3: 1. Number of student who get a B = 4
Number of student who got a C = 48
2. Null and alternative hypothesis:
H0:p1=0.05,p2=0.15,p3=0.35,p4=0.30,p5=0.15
Ha: Some or all of the actual probabilities differs from those specified by Ho.
This is a right tailed test.
3.
The following table is obtained:
| Categories | Observed | Expected | (fo-fe)2/fe |
| A | 9 | 120*0.05=6 | (9-6)2/6 = 1.5 |
| B | 4 | 120*0.15=18 | (4-18)2/18 = 10.889 |
| C | 48 | 120*0.35=42 | (48-42)2/42 = 0.857 |
| D | 37 | 120*0.30=36 | (37-36)2/36 = 0.028 |
| F | 22 | 120*0.15=18 | (22-18)2/18 = 0.889 |
| Sum = | 120 | 120 | 14.163 |
χ² = ∑ ((O-E)²/E) = 14.163
df = 5-1 =4
p-value = CHISQ.DIST.RT(14.163, 4) = 0.0068
4. Reject the null hypothesis Ho.
--------------------------------
Q4: 1. Null and alternative hypothesis:
Ho: The proportions are the same.
H1: The proportions are not the same.
This is a right tailed test.
2. The following table is obtained:
| Categories | Observed | Expected | (fo-fe)2/fe |
| Murder | 4 | 580*0.015=8.7 | (4-8.7)2/8.7 = 2.539 |
| Rape | 35 | 580*0.055=31.9 | (35-31.9)2/31.9 = 0.301 |
| Robbery | 202 | 580*0.340=197.2 | (202-197.2)2/197.2 = 0.117 |
| Assault | 339 | 580*0.590=342.2 | (339-342.2)2/342.2 = 0.03 |
| Sum = | 580 | 580 | 2.987 |
χ² = ∑ ((O-E)²/E) = 2.987
df = 4-1 =3
p-value = CHISQ.DIST.RT(2.987, 3) = 0.3936
3. Fail to reject the null hypothesis Ho.
4. There is not enough evidence to conclude.
Add Answer to:
Question 1 of 4 For the following observed and expected frequencies: Observed 39 43 42 109 Expected 38 48 45 S 6 Download data Test the hypothesis that the distribution of the observed fr...
A distribution and the observed frequencies of the values of a variable from a simple random sample of the population are provided below. Use the chi-square goodness-of-fit test to decide, at the spe...
 A distribution and the observed frequencies of the values of a variable from a simple random sample of the population are provided below. Use the chi-square goodness-of-fit test to decide, at the specified significance level, whether the distribution of the variable differs from the given distribution Distribution: 0.1875, 0.1875, Observed frequencies: 16, 20, 24, 36 Significance level 0.05 0.3125, 0.3125 Determine the null and alternative hypotheses. Choose the correct answer below. OA. H: The distribution of the variable differs from...
Following are observed frequencies. The null hypothesis is Ho P1-0.25, p2-0.17, p3-0.26, P4 0.32 Category1 2...
 Following are observed frequencies. The null hypothesis is Ho P1-0.25, p2-0.17, p3-0.26, P4 0.32 Category1 2 3 Observed 121119 4 Download data Test the hypothesis that the distribution of the observed frequencies is as given by the null hypothesis. Use the a -0.05 level of significance. Part 1 out of 7 Compute the expected frequencies. Round the answers to two decimal places. Category o 12 4 19 20-33 YE-
Consider the following discrete probability distribution along with observed frequencies for each day of the week....
Consider the following discrete probability distribution along with observed frequencies for each day of the week. Complete parts a and b below. Weekday Monday Tuesday Wednesday Thursday Friday Total Probability 0.10 0.20 0.05 0.30 0.35 1.00 Observed Frequency, f Subscript o 12 26 9 39 44 130 a. Perform a chi-square test using alphaequals0.05 to determine if the observed frequencies follow a discrete probability distribution. Determine the null and alternative hypotheses. Choose the correct answer below. A. Upper H 0:...
Question 4 of 7 (1 point) Attempt 1 of Unlimited View question in a popup 8.3...
 Question 4 of 7 (1 point) Attempt 1 of Unlimited View question in a popup 8.3 Section Exercise 16 (p-value College tuition: The mean annual tuition and fees in the 2013-2014 academic year for a sample of 22 private colleges in California was $33,750 with a standard deviation of $7400. A dotplot shows that it is reasonable to assume that the population is approximately normal. Can you conclude that the mean tuition and fees for private institutions in California is...
1. A researcher intends to use a Chi2 test for Goodness of Fit to determine whether...
1. A researcher intends to use a Chi2 test for Goodness of Fit to determine whether there is any preference between 10 brands of cookies. What is the critical Chi2 value for a sample of n = 300 participants and p < .01? A. 20.48 B. 11.07 C. 16.92 D. 18.31 E. 21.67 2. A researcher conducted a study on a sample of n = 80 undergraduates to evaluate preferences among students for four different textbooks for the Introduction to...
Question 1 In a chi -square test of independence , the null hypothesis states that-----------. a....
Question 1 In a chi -square test of independence , the null hypothesis states that-----------. a. the two variables of interest are related in the population. b. the column frequencies equal the row frequencies c. the sum of the and the column frequencies equal the total frequency d. the two variables of interest are unrelated in the population Question 2 A survey asked people whether they identified as a morning person, night person, or had no preference. a. 270 replied...
Pls help me! Question 2 of 3 (4 points)Attempt 1 of 1 How much is in...
 Pls help me!
Question 2 of 3 (4 points)Attempt 1 of 1 How much is in that can? A machine that fills beverage cans is supposed to put 12 ounces of beverage in each can, Following are the amounts measured in a simple random sample of eight cans. 11.96 11.89 12.02 11.80 11.82 12.05 12.06 11.95 to Exce Perform a hypothesis test to determine whether the mean volume is less than 12 ounces. Use the α" 0.10 level of significance...
Pls help me!
Question 2 of 3 (4 points)Attempt 1 of 1 How much is in that can? A machine that fills beverage cans is supposed to put 12 ounces of beverage in each can, Following are the amounts measured in a simple random sample of eight cans. 11.96 11.89 12.02 11.80 11.82 12.05 12.06 11.95 to Exce Perform a hypothesis test to determine whether the mean volume is less than 12 ounces. Use the α" 0.10 level of significance...
5 4 6 Question 6 of 7 (1 point) Atempt 1 of Unlimited View question in...
 5 4 6 Question 6 of 7 (1 point) Atempt 1 of Unlimited View question in a popup 8.3 Section Exercise 20 (p-value, caic) Watching TV: In 2012, the General Social Survey asked a sample of 1310 people how much time they spent watching TV each day. The mean number of hours was 2.8 with a standard deviation of 2.6. A sociologist claims that people watch a mean of 3 hours of TV per day. Do the data provide sufficient...
Question 13 of 14 (1 point) Attempt 1 of Unlimited View question in a pour 8.2...
 Question 13 of 14 (1 point) Attempt 1 of Unlimited View question in a pour 8.2 Section Exercise 54 (p-va Calibrating a scale: Making sure that the scales used by businesses in the United States are accurate is the responsibility of the National Institute for Standards and Technology (NIST) in Washington, D.C. Suppose that NIST technicians are testing a scale by using a weight known to weigh exactly 1000 grams. The standard deviation for scale reading is known to be...
please help fast You are conducting a multinomial hypothesis test (a = 0.05) for the claim...
 please help fast
You are conducting a multinomial hypothesis test (a = 0.05) for the claim that all 5 categories are equally likely to be selected. Complete the table. Observed Expected Category Frequency Frequency A 21 B 15 с 20 D 7 E 6 Report all answers accurate to three decimal places. But retain unrounded numbers for future calculations. What is the chi-square test-statistic for this data? (Report answer accurate to three decimal places, and remember to use the unrounded...
please help fast
You are conducting a multinomial hypothesis test (a = 0.05) for the claim that all 5 categories are equally likely to be selected. Complete the table. Observed Expected Category Frequency Frequency A 21 B 15 с 20 D 7 E 6 Report all answers accurate to three decimal places. But retain unrounded numbers for future calculations. What is the chi-square test-statistic for this data? (Report answer accurate to three decimal places, and remember to use the unrounded...
 A distribution and the observed frequencies of the values of a variable from a simple random sample of the population are provided below. Use the chi-square goodness-of-fit test to decide, at the specified significance level, whether the distribution of the variable differs from the given distribution Distribution: 0.1875, 0.1875, Observed frequencies: 16, 20, 24, 36 Significance level 0.05 0.3125, 0.3125 Determine the null and alternative hypotheses. Choose the correct answer below. OA. H: The distribution of the variable differs from...
 Following are observed frequencies. The null hypothesis is Ho P1-0.25, p2-0.17, p3-0.26, P4 0.32 Category1 2 3 Observed 121119 4 Download data Test the hypothesis that the distribution of the observed frequencies is as given by the null hypothesis. Use the a -0.05 level of significance. Part 1 out of 7 Compute the expected frequencies. Round the answers to two decimal places. Category o 12 4 19 20-33 YE-
 Question 4 of 7 (1 point) Attempt 1 of Unlimited View question in a popup 8.3 Section Exercise 16 (p-value College tuition: The mean annual tuition and fees in the 2013-2014 academic year for a sample of 22 private colleges in California was $33,750 with a standard deviation of $7400. A dotplot shows that it is reasonable to assume that the population is approximately normal. Can you conclude that the mean tuition and fees for private institutions in California is...
 Pls help me!
Question 2 of 3 (4 points)Attempt 1 of 1 How much is in that can? A machine that fills beverage cans is supposed to put 12 ounces of beverage in each can, Following are the amounts measured in a simple random sample of eight cans. 11.96 11.89 12.02 11.80 11.82 12.05 12.06 11.95 to Exce Perform a hypothesis test to determine whether the mean volume is less than 12 ounces. Use the α" 0.10 level of significance...
Pls help me!
Question 2 of 3 (4 points)Attempt 1 of 1 How much is in that can? A machine that fills beverage cans is supposed to put 12 ounces of beverage in each can, Following are the amounts measured in a simple random sample of eight cans. 11.96 11.89 12.02 11.80 11.82 12.05 12.06 11.95 to Exce Perform a hypothesis test to determine whether the mean volume is less than 12 ounces. Use the α" 0.10 level of significance...
 5 4 6 Question 6 of 7 (1 point) Atempt 1 of Unlimited View question in a popup 8.3 Section Exercise 20 (p-value, caic) Watching TV: In 2012, the General Social Survey asked a sample of 1310 people how much time they spent watching TV each day. The mean number of hours was 2.8 with a standard deviation of 2.6. A sociologist claims that people watch a mean of 3 hours of TV per day. Do the data provide sufficient...
 Question 13 of 14 (1 point) Attempt 1 of Unlimited View question in a pour 8.2 Section Exercise 54 (p-va Calibrating a scale: Making sure that the scales used by businesses in the United States are accurate is the responsibility of the National Institute for Standards and Technology (NIST) in Washington, D.C. Suppose that NIST technicians are testing a scale by using a weight known to weigh exactly 1000 grams. The standard deviation for scale reading is known to be...
 please help fast
You are conducting a multinomial hypothesis test (a = 0.05) for the claim that all 5 categories are equally likely to be selected. Complete the table. Observed Expected Category Frequency Frequency A 21 B 15 с 20 D 7 E 6 Report all answers accurate to three decimal places. But retain unrounded numbers for future calculations. What is the chi-square test-statistic for this data? (Report answer accurate to three decimal places, and remember to use the unrounded...
please help fast
You are conducting a multinomial hypothesis test (a = 0.05) for the claim that all 5 categories are equally likely to be selected. Complete the table. Observed Expected Category Frequency Frequency A 21 B 15 с 20 D 7 E 6 Report all answers accurate to three decimal places. But retain unrounded numbers for future calculations. What is the chi-square test-statistic for this data? (Report answer accurate to three decimal places, and remember to use the unrounded...
Most questions answered within 3 hours.
-
if the plasmid concentration is 100 ng/ul how much ul need to be
added to the...
asked 6 minutes ago -
I need this code in java.
Loops do just what they sound like they should -...
asked 3 minutes ago -
Your company wants to raise $11.0 million by issuing 30-year
zero-coupon bonds. If the yield to...
asked 27 minutes ago -
Determine the pressure exerted by 3.99 mol of gas in a 2.92-L
container at 32oC
asked 7 minutes ago -
Riverbed Corp purchased a new blending machine for $3,050.01. It
paid $520.22 down and financed the...
asked 17 minutes ago -
Explain what is involved in pursuing a policy of
nondiscrimination.
asked 10 minutes ago -
A company faces an inverse demand curve of p = 17 − 2Q and its
cost...
asked 24 minutes ago -
The number of claims for lost luggage in a small city airport
averages 8 per day....
asked 25 minutes ago -
Radio waves, from your favorite radio station has a frequency of
( 89.3) MHz (megahertz). What...
asked 29 minutes ago -
In how many ways can one obtain at least three jacks in a six
card hand?...
asked 42 minutes ago -
Neal Nicely was driving on the parkway when he noticed two little
2. old ladies on...
asked 47 minutes ago -
The size of a movement ALONG a demand curve caused by a shift in
supply would...
asked 44 minutes ago