An economist with a major bank wants to learn, quantitatively, how much spending on luxury goods and services can be explained based on consumers’ perception about the current state of the economy and...
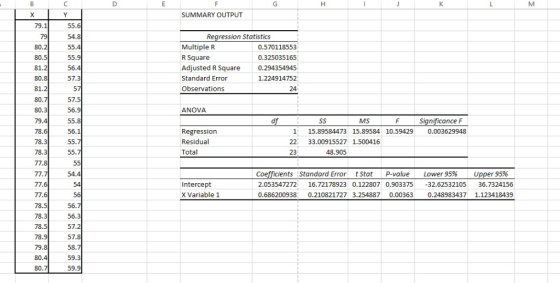
An economist with a major bank wants to learn, quantitatively, how much spending on luxury goods and services can be explained based on consumers’ perception about the current state of the economy and what do they expect in the near future (6 months ahead). Consumers, of all income and wealth classes, were surveyed. Every year, 1500 consumers were interviewed. The bank having all of the data from the 1500 consumers interviewed every year, computed the average level of consumer confidence (an index ranging from 0 to 100, 100 being absolutely optimistic) and computed the average dollar amount spent on luxuries annually. Below is the data shown for the last 24 years.
Date X Y (in thousands of dollars)
1994 79.1 55.6
1995 79 54.8
1996 80.2 55.4
1997 80.5 55.9
1998 81.2 56.4
1999 80.8 57.3
2000 81.2 57
2001 80.7 57.5
2002 80.3 56.9
2003 79.4 55.8
2004 78.6 56.1
2005 78.3 55.7
2006 78.3 55.7
2007 77.8 55
2008 77.7 54.4
2009 77.6 54
2010 77.6 56
2011 78.5 56.7
2012 78.3 56.3
2013 78.5 57.2
2014 78.9 57.8
2015 79.8 58.7
2016 80.4 59.3
2017 80.7 59.9
Questions:
- Measure the strength of the linear association between consumers’ moods and the dollar amounts spent on luxury items.
- Construct the linear regression model for the dollar amount spent on luxury goods and services.
- Explain how you would interpret the slope and the intercept of the regression model.
- How well does our model fit the data? Explain what it means.
- Do you think that measuring the level of optimism is a good predictor for trying to forecast future spending on luxury items? Explain why or why not.
- How would you be able to improve on the model? You must provide a minimum of two specific ways to go about improving the model.
- If the economist expects that, by year’s end, the average level of consumer confidence will hit 81.5 points, how much will be expected by consumers to spend on luxury items?
Homework Answers

Add Answer to:
An economist with a major bank wants to learn, quantitatively, how much spending on luxury goods and services can be explained based on consumers’ perception about the current state of the economy and...
An economist with a major bank wants to learn, quantitatively, how much spending on luxury goods and services can be explained based on consumers’ perception about the current state of the economy and...
An economist with a major bank wants to learn, quantitatively, how much spending on luxury goods and services can be explained based on consumers’ perception about the current state of the economy and what do they expect in the near future (6 months ahead). Consumers, of all income and wealth classes, were surveyed. Every year, 1500 consumers were interviewed. The bank having all of the data from the 1500 consumers interviewed every year, computed the average level of consumer confidence...
Most questions answered within 3 hours.
-
A pebble with mass m is thrown straight up with an initial speed
v0 so that...
asked 44 seconds ago -
Let X be a discrete random variable that follows a
binomial distribution with n = 11...
asked 9 minutes ago -
The equilibrium constant, K, for the following reaction is
1.29×10⁻² at 600
K.
COCl2(g) --->
CO(g)...
asked 22 minutes ago -
It is known that 72% of people have a favorable opinion of their
local police force....
asked 25 minutes ago -
A vertical straight wire carrying an upward 26-A current exerts
an attractive force per unit length...
asked 38 minutes ago -
For the purposes of this assignment, you are to choose an
adaptive trait common to more...
asked 46 minutes ago -
Two identical flutes can play middle C (262 Hz) at 20◦C. How
many beats per second...
asked 54 minutes ago -
Potassium phosphate and calcium chloride react in a double
replacement reaction. To produce 1.0 moles of...
asked 49 minutes ago -
Sparky, Co. purchased land as a factory site for $600,000.
Sparky paid $42,000 to tear down...
asked 1 hour ago -
A Chi-square distribution with 14 degrees of freedom is a
correct model for
Question 8 options:...
asked 1 hour ago -
In a group of 45 mice, there are 10 that have a certain genetic
character. suppose...
asked 1 hour ago -
Topic: Hydrogenic Atoms
The wavefunction of one of the d orbitals is proportional to sin
θ...
asked 1 hour ago