
Homework Answers


Add Answer to:
Question 4 of 7 (1 point) Attempt 1 of Unlimited View question in a popup 8.3...
Question 5 of 7 tpoint) Attempt 1 of Unlimited View question in a popup 8.3 Section...
 Question 5 of 7 tpoint) Attempt 1 of Unlimited View question in a popup 8.3 Section Exercise 18 ( p a c) Good credit: The Fair Isaac Corporation (FICO) credit score is used by banks and other lenders to determine whether someone is a good credit risk. Scores range from 300 to 850, with a score of 720 or more indicating that a person is a very good credit risk. An economist wants to determine whether the mean FICO score...
please explain how to find p-value What are you drinking? Environmental Protection Agency standards require that...
 please explain how to find p-value
What are you drinking? Environmental Protection Agency standards require that the amount of lead in drinking water be less than 1 micrograms per liter. Eleven samples of water from a particular source have the following concentrations, in units of micrograms per liter. Assume the population standard deviation is . If appropriate, perform a hypothesis test to determine whether you can conclude that the mean concentration of lead meets the EPA standards. Use the 0.03...
please explain how to find p-value
What are you drinking? Environmental Protection Agency standards require that the amount of lead in drinking water be less than 1 micrograms per liter. Eleven samples of water from a particular source have the following concentrations, in units of micrograms per liter. Assume the population standard deviation is . If appropriate, perform a hypothesis test to determine whether you can conclude that the mean concentration of lead meets the EPA standards. Use the 0.03...
The mean annual tuition and fees in the 2013-2014 academic year for a sample of 24...
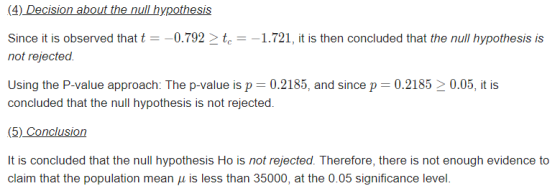
The mean annual tuition and fees in the 2013-2014 academic year for a sample of 24 private colleges in California was $37,000 with a standard deviation of $7800. A dot plot shows that it is reasonable to assume that the population is approximately normal. Can you conclude that the mean tuition and fees for private institutions in California is greater than $35,000? Use the α=0.10 level of significance and P-value method with the Critical Values for the Student's t Distribution...
Question 7 of 7 (1 point) Attempt 1 of Unlimited View question in a ponun 8.3...
 Question 7 of 7 (1 point) Attempt 1 of Unlimited View question in a ponun 8.3 Section Exercise 22 p-value, cale) How much is in that can? A machine that fills beverage cans is supposed to put 12 ounces of beverage in each can. Following are the amounts measured in a simple random sample of eight cans. 12.09 11.98 12.16 12.03 12.12 12.20 12.10 12.18 Sene date Perform a hypothesis test to determine whether the mean volume differs from 12...
5 4 6 Question 6 of 7 (1 point) Atempt 1 of Unlimited View question in...
 5 4 6 Question 6 of 7 (1 point) Atempt 1 of Unlimited View question in a popup 8.3 Section Exercise 20 (p-value, caic) Watching TV: In 2012, the General Social Survey asked a sample of 1310 people how much time they spent watching TV each day. The mean number of hours was 2.8 with a standard deviation of 2.6. A sociologist claims that people watch a mean of 3 hours of TV per day. Do the data provide sufficient...
The mean annual tuition and fees for a sample of 14 private colleges in Califormia was...
 The mean annual tuition and fees for a sample of 14 private colleges in Califormia was $37,900 with a standard deviation of $7,200. A dotplot shows that it is reasonable to assume that the population is approximately normal Can you conclude that the mean tuition and fees for private institutions in California differs from $35,000? Use a 0.01 level of significance. a. Which function would you use in your calculator to perform the hypothesis test? H0 b. Determine the null...
Question 2 (1 point) The mean annual tuition and fees for a sample of 7 private...
 Question 2 (1 point) The mean annual tuition and fees for a sample of 7 private colleges was $28,179 with a standard deviation of $4,546. A dotplot shows that it is reasonable to assume that the population is approximately normal. A researcher wants to test to see if the mean tuition and fees for private institutions differs from $30,000. Compute the value of the test. Write down your P-value. You will need it for the next question. Write only a...
The mean annual tuition and fees for a sample of 14 private colleges in Califormia was...
 The mean annual tuition and fees for a sample of 14 private colleges in Califormia was $37,900 with a standard deviation of $7,200. A dotplot shows that it is reasonable to assume that the population is approximately normal. Can you conclude that the mean tuition and fees for private institutions in Califomia differs from $35,000? Use a 0.01 level of significance. a. Which function would you use in your calculator to perform the hypothesis test? b. Determine the null hypothesis....
Question 12 of 14 (1 point) Attempt 1 of Unlimited View question in a popup 8.2 Section Exercise 52 (p-value Are yo...
 Question 12 of 14 (1 point) Attempt 1 of Unlimited View question in a popup 8.2 Section Exercise 52 (p-value Are you smarter than a second-grader? A random sample of 51 second-graders in a certain school district are given a standardized mathematics skills test. The sample mean score is x = 44. Assume the standard deviation of test scores is o=15. The nationwide average score on this test is 50. The school superintendent wants to know whether the second-graders in...
Question 1 of 10 (1 point) | Attempt 6 of Unlimited View question in a popup...
 Question 1 of 10 (1 point) | Attempt 6 of Unlimited View question in a popup 11.1 Section Exercise 13 (critical value, table) Contaminated water: The concentration of benzene was measured in units of milligrams per liter for a simple random sample of five specimens of untreated wastewater produced at a gas field. The sample mean was 8.3 with a sample standard deviation of 1.1. Seven specimens of treated wastewater had an average benzene concentration of 3.7 with a standard...
 Question 5 of 7 tpoint) Attempt 1 of Unlimited View question in a popup 8.3 Section Exercise 18 ( p a c) Good credit: The Fair Isaac Corporation (FICO) credit score is used by banks and other lenders to determine whether someone is a good credit risk. Scores range from 300 to 850, with a score of 720 or more indicating that a person is a very good credit risk. An economist wants to determine whether the mean FICO score...
 please explain how to find p-value
What are you drinking? Environmental Protection Agency standards require that the amount of lead in drinking water be less than 1 micrograms per liter. Eleven samples of water from a particular source have the following concentrations, in units of micrograms per liter. Assume the population standard deviation is . If appropriate, perform a hypothesis test to determine whether you can conclude that the mean concentration of lead meets the EPA standards. Use the 0.03...
please explain how to find p-value
What are you drinking? Environmental Protection Agency standards require that the amount of lead in drinking water be less than 1 micrograms per liter. Eleven samples of water from a particular source have the following concentrations, in units of micrograms per liter. Assume the population standard deviation is . If appropriate, perform a hypothesis test to determine whether you can conclude that the mean concentration of lead meets the EPA standards. Use the 0.03...
 Question 7 of 7 (1 point) Attempt 1 of Unlimited View question in a ponun 8.3 Section Exercise 22 p-value, cale) How much is in that can? A machine that fills beverage cans is supposed to put 12 ounces of beverage in each can. Following are the amounts measured in a simple random sample of eight cans. 12.09 11.98 12.16 12.03 12.12 12.20 12.10 12.18 Sene date Perform a hypothesis test to determine whether the mean volume differs from 12...
 5 4 6 Question 6 of 7 (1 point) Atempt 1 of Unlimited View question in a popup 8.3 Section Exercise 20 (p-value, caic) Watching TV: In 2012, the General Social Survey asked a sample of 1310 people how much time they spent watching TV each day. The mean number of hours was 2.8 with a standard deviation of 2.6. A sociologist claims that people watch a mean of 3 hours of TV per day. Do the data provide sufficient...
 The mean annual tuition and fees for a sample of 14 private colleges in Califormia was $37,900 with a standard deviation of $7,200. A dotplot shows that it is reasonable to assume that the population is approximately normal Can you conclude that the mean tuition and fees for private institutions in California differs from $35,000? Use a 0.01 level of significance. a. Which function would you use in your calculator to perform the hypothesis test? H0 b. Determine the null...
 Question 2 (1 point) The mean annual tuition and fees for a sample of 7 private colleges was $28,179 with a standard deviation of $4,546. A dotplot shows that it is reasonable to assume that the population is approximately normal. A researcher wants to test to see if the mean tuition and fees for private institutions differs from $30,000. Compute the value of the test. Write down your P-value. You will need it for the next question. Write only a...
 The mean annual tuition and fees for a sample of 14 private colleges in Califormia was $37,900 with a standard deviation of $7,200. A dotplot shows that it is reasonable to assume that the population is approximately normal. Can you conclude that the mean tuition and fees for private institutions in Califomia differs from $35,000? Use a 0.01 level of significance. a. Which function would you use in your calculator to perform the hypothesis test? b. Determine the null hypothesis....
 Question 12 of 14 (1 point) Attempt 1 of Unlimited View question in a popup 8.2 Section Exercise 52 (p-value Are you smarter than a second-grader? A random sample of 51 second-graders in a certain school district are given a standardized mathematics skills test. The sample mean score is x = 44. Assume the standard deviation of test scores is o=15. The nationwide average score on this test is 50. The school superintendent wants to know whether the second-graders in...
 Question 1 of 10 (1 point) | Attempt 6 of Unlimited View question in a popup 11.1 Section Exercise 13 (critical value, table) Contaminated water: The concentration of benzene was measured in units of milligrams per liter for a simple random sample of five specimens of untreated wastewater produced at a gas field. The sample mean was 8.3 with a sample standard deviation of 1.1. Seven specimens of treated wastewater had an average benzene concentration of 3.7 with a standard...
Most questions answered within 3 hours.
-
Combustion of hydrocarbons such as ethane ( C 2 H 6 ) produces
carbon dioxide, a...
asked 23 minutes ago -
For the reaction: 2A + 3B ---> 3D, if the rate of formation
of D is...
asked 24 minutes ago -
At 25 °C, a solution has a hydronium ion concentration of
2.70×10⁻⁸ M.
What is the...
asked 39 minutes ago -
If gatsby wants to ensure that it can start each month with
sufficient denim on hand...
asked 36 minutes ago -
CISC 1115 Assignment 6 Write a complete program, including
javadoc comments, to process voter statistics Input...
asked 1 hour ago -
Use De Broglie's wave equation to calculate the wavelength of an
electron moving at the speed...
asked 1 hour ago -
SargentMud Corporation makes custom mud sculptures and is very
labor intensive so they apply overhead cost...
asked 49 minutes ago -
If the Henry’s law constant for oxygen in water is 1.3 x 10⁻³
M/atm at 25...
asked 1 hour ago -
A laser with a wavelength of 470. nm illuminates two narrow
slits. The interference pattern from...
asked 1 hour ago -
1) In your own words, explain what elasticity of supply is
signifying. (Put in your own...
asked 1 hour ago -
Who is ultimately responsible for formulating a firm's strategy
-- its managers, employees, or both? Explain.
asked 58 minutes ago -
The risk of material misstatement due to fraud relating to
revenue recognition should be a. given...
asked 1 hour ago