

Homework Answers
Answer:1
This is given that all the category having equal probability since be take 0.20 for each . and apply the test.
The following table is obtained:
| Categories | Observed | Expected | (fo-fe)2/fe |
| A | 21 | 69*0.20=13.8 | (21-13.8)2/13.8 = 3.757 |
| B | 15 | 69*0.20=13.8 | (15-13.8)2/13.8 = 0.104 |
| C | 20 | 69*0.20=13.8 | (20-13.8)2/13.8 = 2.786 |
| D | 7 | 69*0.20=13.8 | (7-13.8)2/13.8 = 3.351 |
| E | 6 | 69*0.20=13.8 | (6-13.8)2/13.8 = 4.409 |
| Sum = | 69 | 69 | 14.406 |
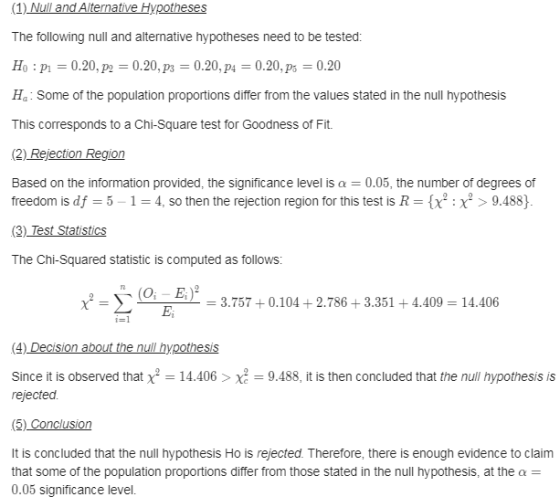
therefore results are
Chi square value = 14.406
d.f = 4
p value = 0.0061
Answer:2 a)
| Categories | Observed | Expected | (fo-fe)2/fe |
| Category 1 | 19 | 146*0.13=18.98 | (19-18.98)2/18.98 = 0 |
| Category 2 | 33 | 146*0.14=20.44 | (33-20.44)2/20.44 = 7.718 |
| Category 3 | 27 | 146*0.13=18.98 | (27-18.98)2/18.98 = 3.389 |
| Category 4 | 21 | 146*0.24=35.04 | (21-35.04)2/35.04 = 5.626 |
| Category 5 | 15 | 146*0.20=29.2 | (15-29.2)2/29.2 = 6.905 |
| Category 6 | 31 | 146*0.16=23.36 | (31-23.36)2/23.36 = 2.499 |
| Sum = | 146 | 146 | 26.137 |
b)

c) Final answer:
Chi square value = 26.137
p value = 0.0001
Add Answer to:
please help fast
You are conducting a multinomial hypothesis test (a = 0.05) for the claim...
The manufacturer of a certain candy states that 15% of the candies are brown, 15% yellow,...
 The manufacturer of a certain candy states that 15% of the candies are brown, 15% yellow, 25% red, 20% blue, 10% orange, 15% green. A student randomly selected a giant bag of candy and counted the number of each color. The results are in the table below. Does the candy follow the stated distribution? (a) Complete the table. Report all answers accurate to 2 decimal places. Color Brown Yellow Red Blue Orange Green Frequency 17 27 37 42 33 23...
please help fast You are conducting a multinomial hypothesis test (a = 0.05) for the claim...
 please help fast
You are conducting a multinomial hypothesis test (a = 0.05) for the claim that all 5 categories are equally likely to be selected. Complete the table. Observed Expected Category Frequency Frequency А 13 B 5 с 14 D 15 E 8 Report all answers accurate to three decimal places. But retain unrounded numbers for future calculations. What is the chi-square test-statistic for this data? (Report answer accurate to three decimal places, and remember to use the unrounded...
please help fast
You are conducting a multinomial hypothesis test (a = 0.05) for the claim that all 5 categories are equally likely to be selected. Complete the table. Observed Expected Category Frequency Frequency А 13 B 5 с 14 D 15 E 8 Report all answers accurate to three decimal places. But retain unrounded numbers for future calculations. What is the chi-square test-statistic for this data? (Report answer accurate to three decimal places, and remember to use the unrounded...
You are conducting a multinomial hypothesis test (αα = 0.05) for the claim that all 5...
You are conducting a multinomial hypothesis test (αα = 0.05) for the claim that all 5 categories are equally likely to be selected. Complete the table. Category Observed Frequency Expected Frequency Squared Pearson Residual A 21 B 12 C 16 D 8 E 24 Report all answers accurate to three decimal places. But retain unrounded numbers for future calculations. What is the chi-square test-statistic for this data? (Report answer accurate to three decimal places, and remember to use the unrounded...
Homework Homework 6.3 You are conducting a multinomial Goodness of Fit hypothesis test for the claim...
 Homework Homework 6.3 You are conducting a multinomial Goodness of Fit hypothesis test for the claim that the 4 categories occur with the following frequencies: H, PA = 0.2; p = 0.3; pc - 0.2: PD = 0.3 Complete the table. Report all answers accurate to three decimal places. Category Observed Expected Frequency Frequency A 9 B 29 C 24 D 23 What is the chi-square test statistic for this data? x? What is the P.Value? P-Value - For significance...
You are conducting a multinomial Goodness of Fit hypothesis test for the claim that the 4 categor...
 You are conducting a
multinomial Goodness of Fit hypothesis test for the claim that the
4 categories occur with the following frequencies: H o : p A = 0.3
; p B = 0.1 ; p C = 0.1 ; p D = 0.5 Complete the table. Report all
answers accurate to three decimal places. Category Observed
Frequency Expected Frequency A 50 B 38 C 19 D 66 What is the
chi-square test-statistic for this data? χ 2 = What...
You are conducting a
multinomial Goodness of Fit hypothesis test for the claim that the
4 categories occur with the following frequencies: H o : p A = 0.3
; p B = 0.1 ; p C = 0.1 ; p D = 0.5 Complete the table. Report all
answers accurate to three decimal places. Category Observed
Frequency Expected Frequency A 50 B 38 C 19 D 66 What is the
chi-square test-statistic for this data? χ 2 = What...
A manufacturer of colored candies states that 13% of the candies in a bag should be...
 A manufacturer of colored candies states that 13% of the candies in a bag should be brown, 14% yellow, 13% red, 24% blue, 20% orange, and 16% green. A student randomly selected a bag of colored candies. He counted the number of candies of each color and obtained the results shown in the table. Test whether the bag of colored candies follows the distribution stated above at the a= 0.05 level of significance. Click the icon to view the table....
You are conducting a multinomial Goodness of Fit hypothesis test for the claim that the 4...
 You are conducting a multinomial Goodness of Fit hypothesis test for the claim that the 4 categories occur with the following frequencies Complete the table. Report all answers accurate to three decimal places Observed Expected Category Frequency Frequency A 51 B 30 С 137 D 41 What is the chi-square test-statistic for this data? What is the P-Value? P-Value- For significance level alpha 0.05, What would be the conclusion of this hypothesis test? O Fail to reject the Null Hypothesis...
Can someone please help me with this question? 13.1 You are conducting a multinomial hypothesis test...
Can someone please help me with this question? 13.1 You are conducting a multinomial hypothesis test (αα = 0.05) for the claim that all 5 categories are equally likely to be selected. a. Complete the table. Category Observed Frequency Expected Frequency A 11 B 9 C 22 D 7 E 11 Report all answers accurate to three decimal places. But retain unrounded numbers for future calculations. b. What is the chi-square test-statistic for this data? (Report answer accurate to three...
A manufacturer of colored candies states that 13% of the candies in a bag should be...
 A manufacturer of colored candies states that 13% of the candies in a bag should be brown, 14% yellow, 13% red, 24% blue, 20% orange, and 16% green. A student randomly selected a bag of colored candies. He nted the number of candies of each color and obtained the results shown in the table. Test whether the bag of colored candies follows the distribution stated above at the α = 0.05 level of significa Click the icon to view the...
A manufacturer of colored candies states that 13% of the candies in a bag should be...
 A manufacturer of colored candies states that 13% of the candies in a bag should be brown, 14% yellow, 13% red, 24% blue, 20% orange, and 16% green. A student randomly selected a bag of colored candies. He counted the number of candies of each color and obtained the results shown in the table. Test whether the bag of colored candies follows the distribution stated above at the α = 0.05 level of significance. 囲Click the icon to view, the...
 The manufacturer of a certain candy states that 15% of the candies are brown, 15% yellow, 25% red, 20% blue, 10% orange, 15% green. A student randomly selected a giant bag of candy and counted the number of each color. The results are in the table below. Does the candy follow the stated distribution? (a) Complete the table. Report all answers accurate to 2 decimal places. Color Brown Yellow Red Blue Orange Green Frequency 17 27 37 42 33 23...
 please help fast
You are conducting a multinomial hypothesis test (a = 0.05) for the claim that all 5 categories are equally likely to be selected. Complete the table. Observed Expected Category Frequency Frequency А 13 B 5 с 14 D 15 E 8 Report all answers accurate to three decimal places. But retain unrounded numbers for future calculations. What is the chi-square test-statistic for this data? (Report answer accurate to three decimal places, and remember to use the unrounded...
please help fast
You are conducting a multinomial hypothesis test (a = 0.05) for the claim that all 5 categories are equally likely to be selected. Complete the table. Observed Expected Category Frequency Frequency А 13 B 5 с 14 D 15 E 8 Report all answers accurate to three decimal places. But retain unrounded numbers for future calculations. What is the chi-square test-statistic for this data? (Report answer accurate to three decimal places, and remember to use the unrounded...
 Homework Homework 6.3 You are conducting a multinomial Goodness of Fit hypothesis test for the claim that the 4 categories occur with the following frequencies: H, PA = 0.2; p = 0.3; pc - 0.2: PD = 0.3 Complete the table. Report all answers accurate to three decimal places. Category Observed Expected Frequency Frequency A 9 B 29 C 24 D 23 What is the chi-square test statistic for this data? x? What is the P.Value? P-Value - For significance...
 You are conducting a
multinomial Goodness of Fit hypothesis test for the claim that the
4 categories occur with the following frequencies: H o : p A = 0.3
; p B = 0.1 ; p C = 0.1 ; p D = 0.5 Complete the table. Report all
answers accurate to three decimal places. Category Observed
Frequency Expected Frequency A 50 B 38 C 19 D 66 What is the
chi-square test-statistic for this data? χ 2 = What...
You are conducting a
multinomial Goodness of Fit hypothesis test for the claim that the
4 categories occur with the following frequencies: H o : p A = 0.3
; p B = 0.1 ; p C = 0.1 ; p D = 0.5 Complete the table. Report all
answers accurate to three decimal places. Category Observed
Frequency Expected Frequency A 50 B 38 C 19 D 66 What is the
chi-square test-statistic for this data? χ 2 = What...
 A manufacturer of colored candies states that 13% of the candies in a bag should be brown, 14% yellow, 13% red, 24% blue, 20% orange, and 16% green. A student randomly selected a bag of colored candies. He counted the number of candies of each color and obtained the results shown in the table. Test whether the bag of colored candies follows the distribution stated above at the a= 0.05 level of significance. Click the icon to view the table....
 You are conducting a multinomial Goodness of Fit hypothesis test for the claim that the 4 categories occur with the following frequencies Complete the table. Report all answers accurate to three decimal places Observed Expected Category Frequency Frequency A 51 B 30 С 137 D 41 What is the chi-square test-statistic for this data? What is the P-Value? P-Value- For significance level alpha 0.05, What would be the conclusion of this hypothesis test? O Fail to reject the Null Hypothesis...
 A manufacturer of colored candies states that 13% of the candies in a bag should be brown, 14% yellow, 13% red, 24% blue, 20% orange, and 16% green. A student randomly selected a bag of colored candies. He nted the number of candies of each color and obtained the results shown in the table. Test whether the bag of colored candies follows the distribution stated above at the α = 0.05 level of significa Click the icon to view the...
 A manufacturer of colored candies states that 13% of the candies in a bag should be brown, 14% yellow, 13% red, 24% blue, 20% orange, and 16% green. A student randomly selected a bag of colored candies. He counted the number of candies of each color and obtained the results shown in the table. Test whether the bag of colored candies follows the distribution stated above at the α = 0.05 level of significance. 囲Click the icon to view, the...
Most questions answered within 3 hours.
-
In a survey of 1147 small-business owners, the following
question was posed: Would you recommend working...
asked 14 minutes ago -
The value of the equilibrium constant Kc for the reaction
N2(g)+3H2(g)⇌2NH3(g) changes in the following manner...
asked 21 minutes ago -
There are two flasks on the bench top, one flask contains a 0.50
M NaCl solution...
asked 27 minutes ago -
Which of the following aqueous solutions are good buffer
systems?
.
0.10 M hydrofluoric acid +...
asked 28 minutes ago -
2. An S election is terminated if the S corporation has passive
investment income in excess...
asked 30 minutes ago -
Part of an ANOVA table is shown below.
Source of
Variation
Sum of
Squares
Degrees of...
asked 47 minutes ago -
Business process improvement initiatives often include
introducing new technology to support the new or changed ways...
asked 53 minutes ago -
Review your choice of either Agile or the Waterfall models and
for each of the 22...
asked 54 minutes ago -
Suppose an x distribution has mean μ = 4.
Consider two corresponding
x
distributions, the first...
asked 56 minutes ago -
A study of the effects of exercise used rats bred to have high
or low capacity...
asked 1 hour ago -
Using your data from the experiment, calculate the initial moles
of HCl that you started with....
asked 1 hour ago -
Suppose you want to make 500 mL of a 0.20 M Tris buffer at pH
8.0....
asked 1 hour ago