
Homework Answers
The Complete table as
| Category | Observed Frequency | Probability(P) | Expected frequency(P*N) |
| A | 51 | 0.3 | 47.7 |
| B | 30 | 0.15 | 23.85 |
| C | 37 | 0.4 | 63.6 |
| D | 41 | 0.15 | 23.85 |
| N= | 159 |
Chi Square is calculated as
Using the data in Excel
Chi-Square is computed as
| Category | Observed Frequency | Probability(P) | Expected frequency(P*N) | Residual(Obs-Exp) | (obs-exp)^2 | {(Obs-Exp)}^2/Exp |
| A | 51 | 0.3 | 47.7 | 3.3 | 10.89 | 0.228301887 |
| B | 30 | 0.15 | 23.85 | 6.15 | 37.8225 | 1.585849057 |
| C | 37 | 0.4 | 63.6 | -26.6 | 707.56 | 11.12515723 |
| D | 41 | 0.15 | 23.85 | 17.15 | 294.1225 | 12.33218029 |
| N= | 159 | Chi Square= | 25.27148847 |
Hence, Chi square=25.272
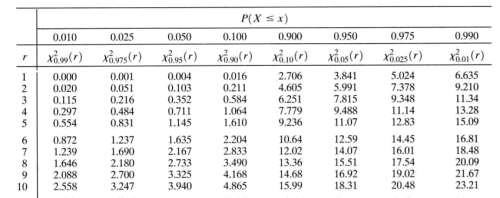
c) P value associated with Chi Square is computed using Chi-square table as
P value=0.000014
d) Conclusion:
Since P value<<0.05( level of significance) hence, reject the null hypothesis.
Add Answer to:
You are conducting a multinomial Goodness of Fit hypothesis test for the claim that the 4...
You are conducting a multinomial Goodness of Fit hypothesis test for the claim that the 4 categor...
 You are conducting a
multinomial Goodness of Fit hypothesis test for the claim that the
4 categories occur with the following frequencies: H o : p A = 0.3
; p B = 0.1 ; p C = 0.1 ; p D = 0.5 Complete the table. Report all
answers accurate to three decimal places. Category Observed
Frequency Expected Frequency A 50 B 38 C 19 D 66 What is the
chi-square test-statistic for this data? χ 2 = What...
You are conducting a
multinomial Goodness of Fit hypothesis test for the claim that the
4 categories occur with the following frequencies: H o : p A = 0.3
; p B = 0.1 ; p C = 0.1 ; p D = 0.5 Complete the table. Report all
answers accurate to three decimal places. Category Observed
Frequency Expected Frequency A 50 B 38 C 19 D 66 What is the
chi-square test-statistic for this data? χ 2 = What...
You are conducting a multinomial Goodness of Fit hypothesis test for the claim that the 4...
You are conducting a multinomial Goodness of Fit hypothesis test for the claim that the 4 categories occur with the following frequencies: HoHo : pA=0.3pA=0.3; pB=0.2pB=0.2; pC=0.2pC=0.2; pD=0.3pD=0.3 Complete the table. Report all answers accurate to three decimal places. Category Observed Frequency Expected Frequency A 28 B 15 C 40 D 32 What is the chi-square test-statistic for this data? χ2=χ2= What is the P-Value? P-Value = For significance level alpha 0.005, What would be the conclusion of this hypothesis test? Fail to...
You are conducting a multinomial Goodness of Fit hypothesis test for the claim that the 4...
You are conducting a multinomial Goodness of Fit hypothesis test for the claim that the 4 categories occur with the following frequencies: HoHo : pA=.2pA=.2; pB=.2pB=.2; pC=.3pC=.3; pD=0.3pD=0.3 Complete the table. Report all answers accurate to three decimal places. Category Observed Frequency Expected Frequency A 19 B 30 C 30 D 32 What is the chi-square test-statistic for this data? χ2=χ2= What is the P-Value? P-Value = For significance level alpha 0.01, What would be the conclusion of this hypothesis test? Reject the...
You are conducting a multinomial Goodness of Fit hypothesis test for the claim that the 4...
You are conducting a multinomial Goodness of Fit hypothesis test for the claim that the 4 categories occur with the following frequencies: Ho : pA=0.3; pB=0.15; pC=0.15; pD=0.4 Complete the table. Report all answers accurate to three decimal places. Category Observed Frequency Expected Frequency A 29 B 41 C 12 D 53 What is the chi-square test-statistic for this data? χ2= What is the P-Value? P-Value = For significance level alpha 0.05, what would be the conclusion of this hypothesis...
You are conducting a multinomial Goodness of Fit hypothesis test for the claim that the 4...
You are conducting a multinomial Goodness of Fit hypothesis test for the claim that the 4 categories occur with the following frequencies: HoHo : pA=0.4pA=0.4; pB=0.1pB=0.1; pC=0.2pC=0.2; pD=0.3pD=0.3 Complete the table. Report all answers accurate to three decimal places. Category Observed Frequency Expected Frequency Residual A 50 B 10 C 16 D 33 What is the chi-square test-statistic for this data? χ2=χ2= For significance level alpha 0.1, what is the chi-square Critical Value? Critical Value = What would be the conclusion of this...
Homework Homework 6.3 You are conducting a multinomial Goodness of Fit hypothesis test for the claim...
 Homework Homework 6.3 You are conducting a multinomial Goodness of Fit hypothesis test for the claim that the 4 categories occur with the following frequencies: H, PA = 0.2; p = 0.3; pc - 0.2: PD = 0.3 Complete the table. Report all answers accurate to three decimal places. Category Observed Expected Frequency Frequency A 9 B 29 C 24 D 23 What is the chi-square test statistic for this data? x? What is the P.Value? P-Value - For significance...
1A) 1B) 1C) 1D) You are conducting a multinomial Goodness of Fit hypothesis test for the...
 1A)
1B)
1C)
1D)
You are conducting a multinomial Goodness of Fit hypothesis test for the claim that the 4 categories occur with the following frequencies: H:PA = 0.1; P = 0.3; Pc = 0.1; Pp = 0.5 Complete the table. Report all answers accurate to three decimal places. Observed Expected Category Frequency Frequency А 17 B 43 с 12 D 48 What is the chi-square test-statistic for this data? x = What is the P-value? P-Value = For significance...
1A)
1B)
1C)
1D)
You are conducting a multinomial Goodness of Fit hypothesis test for the claim that the 4 categories occur with the following frequencies: H:PA = 0.1; P = 0.3; Pc = 0.1; Pp = 0.5 Complete the table. Report all answers accurate to three decimal places. Observed Expected Category Frequency Frequency А 17 B 43 с 12 D 48 What is the chi-square test-statistic for this data? x = What is the P-value? P-Value = For significance...
You are conducting a Goodness of Fit hypothesis test for the claim that all 5 categories...
You are conducting a Goodness of Fit hypothesis test for the claim that all 5 categories are equally likely to be selected. Complete the table. Report all answers correct to three decimal places. Category Observed Frequency Expected Frequency (obs-exp)^2/exp A 21 B 6 C 11 D 8 E 7 What is the chi-square test-statistic for this data? χ2= At the alpha = 0.05 level, what is the conclusion for this test? Fail to reject the null hypothesis Reject the null...
Homework > Homework 6.3 You are conducting a Goodness of Fit hypothesis test for the claim...
 Homework > Homework 6.3 You are conducting a Goodness of Fit hypothesis test for the claim that all 5 categories are equally likely to be selected. Complete the table. Report all answers correct to three decimal places. Category Observed Expected (obs-exp)2/exp Frequency Frequency A 21 B 15 c 10 D 23 E 20 What is the chi-square test statistic for this data? x At the alpha 0.05 level, what is the conclusion for this test? Fail to reject the null...
You are conducting a multinomial hypothesis test for the claim that the 4 categories occur with...
 You are conducting a multinomial hypothesis test for the claim
that the 4 categories occur with the following frequencies: H o : p
A = 0.1 ; p B = 0.25 ; p C = 0.4 ; p D = 0.25
Calculate the test by showing the steps on the calculator.
You are conducting a multinomial hypothesis test for the claim that the 4 categories occur with the following frequencies: Observed Category Frequency A 15 B 32 C 29 D...
You are conducting a multinomial hypothesis test for the claim
that the 4 categories occur with the following frequencies: H o : p
A = 0.1 ; p B = 0.25 ; p C = 0.4 ; p D = 0.25
Calculate the test by showing the steps on the calculator.
You are conducting a multinomial hypothesis test for the claim that the 4 categories occur with the following frequencies: Observed Category Frequency A 15 B 32 C 29 D...
 You are conducting a
multinomial Goodness of Fit hypothesis test for the claim that the
4 categories occur with the following frequencies: H o : p A = 0.3
; p B = 0.1 ; p C = 0.1 ; p D = 0.5 Complete the table. Report all
answers accurate to three decimal places. Category Observed
Frequency Expected Frequency A 50 B 38 C 19 D 66 What is the
chi-square test-statistic for this data? χ 2 = What...
You are conducting a
multinomial Goodness of Fit hypothesis test for the claim that the
4 categories occur with the following frequencies: H o : p A = 0.3
; p B = 0.1 ; p C = 0.1 ; p D = 0.5 Complete the table. Report all
answers accurate to three decimal places. Category Observed
Frequency Expected Frequency A 50 B 38 C 19 D 66 What is the
chi-square test-statistic for this data? χ 2 = What...
 Homework Homework 6.3 You are conducting a multinomial Goodness of Fit hypothesis test for the claim that the 4 categories occur with the following frequencies: H, PA = 0.2; p = 0.3; pc - 0.2: PD = 0.3 Complete the table. Report all answers accurate to three decimal places. Category Observed Expected Frequency Frequency A 9 B 29 C 24 D 23 What is the chi-square test statistic for this data? x? What is the P.Value? P-Value - For significance...
 1A)
1B)
1C)
1D)
You are conducting a multinomial Goodness of Fit hypothesis test for the claim that the 4 categories occur with the following frequencies: H:PA = 0.1; P = 0.3; Pc = 0.1; Pp = 0.5 Complete the table. Report all answers accurate to three decimal places. Observed Expected Category Frequency Frequency А 17 B 43 с 12 D 48 What is the chi-square test-statistic for this data? x = What is the P-value? P-Value = For significance...
1A)
1B)
1C)
1D)
You are conducting a multinomial Goodness of Fit hypothesis test for the claim that the 4 categories occur with the following frequencies: H:PA = 0.1; P = 0.3; Pc = 0.1; Pp = 0.5 Complete the table. Report all answers accurate to three decimal places. Observed Expected Category Frequency Frequency А 17 B 43 с 12 D 48 What is the chi-square test-statistic for this data? x = What is the P-value? P-Value = For significance...
 Homework > Homework 6.3 You are conducting a Goodness of Fit hypothesis test for the claim that all 5 categories are equally likely to be selected. Complete the table. Report all answers correct to three decimal places. Category Observed Expected (obs-exp)2/exp Frequency Frequency A 21 B 15 c 10 D 23 E 20 What is the chi-square test statistic for this data? x At the alpha 0.05 level, what is the conclusion for this test? Fail to reject the null...
 You are conducting a multinomial hypothesis test for the claim
that the 4 categories occur with the following frequencies: H o : p
A = 0.1 ; p B = 0.25 ; p C = 0.4 ; p D = 0.25
Calculate the test by showing the steps on the calculator.
You are conducting a multinomial hypothesis test for the claim that the 4 categories occur with the following frequencies: Observed Category Frequency A 15 B 32 C 29 D...
You are conducting a multinomial hypothesis test for the claim
that the 4 categories occur with the following frequencies: H o : p
A = 0.1 ; p B = 0.25 ; p C = 0.4 ; p D = 0.25
Calculate the test by showing the steps on the calculator.
You are conducting a multinomial hypothesis test for the claim that the 4 categories occur with the following frequencies: Observed Category Frequency A 15 B 32 C 29 D...
Most questions answered within 3 hours.
-
An RLC circuit has a capacitance of 0.29 uF. A. What inductance
will produce a resonance...
asked 3 minutes ago -
A ball is thrown from a point 1.0 m above the ground. The
initial velocity is...
asked 3 minutes ago -
A mass M slides upward along a rough plane surface inclined at
angle \Theta\: Θ =...
asked 9 minutes ago -
Design (draw) a 4 * 4-bit memory system (building block) with
2-bit address bus and 4-bit...
asked 16 minutes ago -
A weak acid (HA) has a pKa of 4.011. If a solution of this acid
has...
asked 23 minutes ago -
What is the Structure of stratified sampling vs cluster
sampling?
asked 31 minutes ago -
An alpha particle is emitted from an unstable nucleus and
travels in a magnetic field of...
asked 38 minutes ago -
3
3. Complete the balance sheet and sales information
in the table that follows J. White...
asked 37 minutes ago -
Using Oracle database
Need help getting the JAVA code for the queries and the rest of...
asked 46 minutes ago -
What is the equation for Hamilton's Rule? How
does it help explain kin selection?
asked 52 minutes ago -
Directions: Read and answer each question carefully. For any
hypothesis test, be sure to state your...
asked 57 minutes ago -
Determine the equilibrium constant for the following reaction at
298 K.
Cl(g) + O3(g) → ClO(g)...
asked 1 hour ago