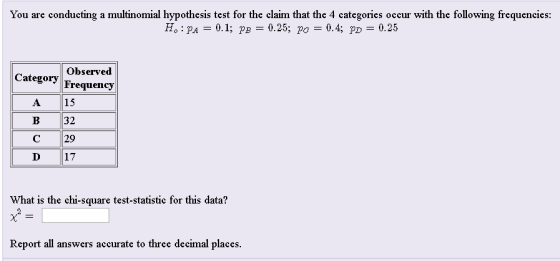
You are conducting a multinomial hypothesis test for the claim that the 4 categories occur with the following frequencies: H o : p A = 0.1 ; p B = 0.25 ; p C = 0.4 ; p D = 0.25
Calculate the test by showing the steps on the calculator.
Homework Answers


Add Answer to:
You are conducting a multinomial hypothesis test for the claim that the 4 categories occur with...
You are conducting a multinomial hypothesis test for the claim that the 4 categories occur with...
You are conducting a multinomial hypothesis test for the claim that the 4 categories occur with the following frequencies: H o : p A = 0.4 ; p B = 0.1 ; p C = 0.25 ; p D = 0.25 Category Observed Frequency A 52 B 35 C 18 D 26 What is the chi-square test-statistic for this data? χ 2 = 44.646 Incorrect Report all answers accurate to three decimal places.
You are conducting a multinomial hypothesis test for the claim that the 4 categories occur with...
You are conducting a multinomial hypothesis test for the claim that the 4 categories occur with the following frequencies: HoHo : pA=0.15pA=0.15; pB=0.3pB=0.3; pC=0.4pC=0.4; pD=0.15pD=0.15 Category Observed Frequency A 39 B 53 C 55 D 26 What is the chi-square test-statistic for this data? χ2=χ2=
You are conducting a multinomial hypothesis test for the claim that the 4 categories occur with...
 You are conducting a multinomial hypothesis test for the claim
that the 4 categories occur with the following frequencies:
HoHo :
pA=0.15pA=0.15; pB=0.3pB=0.3; pC=0.4pC=0.4; pD=0.15pD=0.15
Category
Observed
Frequency
A
39
B
53
C
55
D
26
What is the chi-square test-statistic for this data?
χ2=χ2=
You are conducting a multinomial hypothesis test for the claim
that the 4 categories occur with the following frequencies:
HoHo :
pA=0.15pA=0.15; pB=0.3pB=0.3; pC=0.4pC=0.4; pD=0.15pD=0.15
Category
Observed
Frequency
A
39
B
53
C
55
D
26
What is the chi-square test-statistic for this data?
χ2=χ2=
1A) 1B) 1C) 1D) You are conducting a multinomial hypothesis test for the claim that all...
 1A)
1B)
1C)
1D)
You are conducting a multinomial hypothesis test for the claim that all 5 categories are equally likely to be selected. Complete the table. Round to 3 decimal places. Observed Category Frequency Frequency Expected (0-E) E A 9 B 18 с 19 D 9 E 17 What is the chi-square test-statistic for this data? x2 = Report all answers accurate to three decimal places. You are conducting a multinomial hypothesis test for the claim that all 5...
1A)
1B)
1C)
1D)
You are conducting a multinomial hypothesis test for the claim that all 5 categories are equally likely to be selected. Complete the table. Round to 3 decimal places. Observed Category Frequency Frequency Expected (0-E) E A 9 B 18 с 19 D 9 E 17 What is the chi-square test-statistic for this data? x2 = Report all answers accurate to three decimal places. You are conducting a multinomial hypothesis test for the claim that all 5...
You are conducting a multinomial Goodness of Fit hypothesis test for the claim that the 4 categor...
 You are conducting a
multinomial Goodness of Fit hypothesis test for the claim that the
4 categories occur with the following frequencies: H o : p A = 0.3
; p B = 0.1 ; p C = 0.1 ; p D = 0.5 Complete the table. Report all
answers accurate to three decimal places. Category Observed
Frequency Expected Frequency A 50 B 38 C 19 D 66 What is the
chi-square test-statistic for this data? χ 2 = What...
You are conducting a
multinomial Goodness of Fit hypothesis test for the claim that the
4 categories occur with the following frequencies: H o : p A = 0.3
; p B = 0.1 ; p C = 0.1 ; p D = 0.5 Complete the table. Report all
answers accurate to three decimal places. Category Observed
Frequency Expected Frequency A 50 B 38 C 19 D 66 What is the
chi-square test-statistic for this data? χ 2 = What...
Please explain by using the TI-83 calculator if possible. You are conducting a multinomial hypothesis test...
 Please explain by using the
TI-83 calculator if possible.
You are conducting a multinomial hypothesis test for the claim that the 4 categories occur with the following frequencies: H: PA = 0.25; PB = 0.4; Pc = 0.1; PD = 0.25 Observed Category Frequency 42 ID 27 What is the chi-square test-statistic for this data? x² = 1 Report all answers accurate to three decimal places.
Please explain by using the
TI-83 calculator if possible.
You are conducting a multinomial hypothesis test for the claim that the 4 categories occur with the following frequencies: H: PA = 0.25; PB = 0.4; Pc = 0.1; PD = 0.25 Observed Category Frequency 42 ID 27 What is the chi-square test-statistic for this data? x² = 1 Report all answers accurate to three decimal places.
You are conducting a multinomial Goodness of Fit hypothesis test for the claim that the 4...
You are conducting a multinomial Goodness of Fit hypothesis test for the claim that the 4 categories occur with the following frequencies: Ho : pA=0.3; pB=0.15; pC=0.15; pD=0.4 Complete the table. Report all answers accurate to three decimal places. Category Observed Frequency Expected Frequency A 29 B 41 C 12 D 53 What is the chi-square test-statistic for this data? χ2= What is the P-Value? P-Value = For significance level alpha 0.05, what would be the conclusion of this hypothesis...
You are conducting a multinomial Goodness of Fit hypothesis test for the claim that the 4...
You are conducting a multinomial Goodness of Fit hypothesis test for the claim that the 4 categories occur with the following frequencies: HoHo : pA=0.4pA=0.4; pB=0.1pB=0.1; pC=0.2pC=0.2; pD=0.3pD=0.3 Complete the table. Report all answers accurate to three decimal places. Category Observed Frequency Expected Frequency Residual A 50 B 10 C 16 D 33 What is the chi-square test-statistic for this data? χ2=χ2= For significance level alpha 0.1, what is the chi-square Critical Value? Critical Value = What would be the conclusion of this...
You are conducting a multinomial Goodness of Fit hypothesis test for the claim that the 4...
 You are conducting a multinomial Goodness of Fit hypothesis test for the claim that the 4 categories occur with the following frequencies Complete the table. Report all answers accurate to three decimal places Observed Expected Category Frequency Frequency A 51 B 30 С 137 D 41 What is the chi-square test-statistic for this data? What is the P-Value? P-Value- For significance level alpha 0.05, What would be the conclusion of this hypothesis test? O Fail to reject the Null Hypothesis...
1A) 1B) 1C) 1D) You are conducting a multinomial Goodness of Fit hypothesis test for the...
 1A)
1B)
1C)
1D)
You are conducting a multinomial Goodness of Fit hypothesis test for the claim that the 4 categories occur with the following frequencies: H:PA = 0.1; P = 0.3; Pc = 0.1; Pp = 0.5 Complete the table. Report all answers accurate to three decimal places. Observed Expected Category Frequency Frequency А 17 B 43 с 12 D 48 What is the chi-square test-statistic for this data? x = What is the P-value? P-Value = For significance...
1A)
1B)
1C)
1D)
You are conducting a multinomial Goodness of Fit hypothesis test for the claim that the 4 categories occur with the following frequencies: H:PA = 0.1; P = 0.3; Pc = 0.1; Pp = 0.5 Complete the table. Report all answers accurate to three decimal places. Observed Expected Category Frequency Frequency А 17 B 43 с 12 D 48 What is the chi-square test-statistic for this data? x = What is the P-value? P-Value = For significance...
 You are conducting a multinomial hypothesis test for the claim
that the 4 categories occur with the following frequencies:
HoHo :
pA=0.15pA=0.15; pB=0.3pB=0.3; pC=0.4pC=0.4; pD=0.15pD=0.15
Category
Observed
Frequency
A
39
B
53
C
55
D
26
What is the chi-square test-statistic for this data?
χ2=χ2=
You are conducting a multinomial hypothesis test for the claim
that the 4 categories occur with the following frequencies:
HoHo :
pA=0.15pA=0.15; pB=0.3pB=0.3; pC=0.4pC=0.4; pD=0.15pD=0.15
Category
Observed
Frequency
A
39
B
53
C
55
D
26
What is the chi-square test-statistic for this data?
χ2=χ2=
 1A)
1B)
1C)
1D)
You are conducting a multinomial hypothesis test for the claim that all 5 categories are equally likely to be selected. Complete the table. Round to 3 decimal places. Observed Category Frequency Frequency Expected (0-E) E A 9 B 18 с 19 D 9 E 17 What is the chi-square test-statistic for this data? x2 = Report all answers accurate to three decimal places. You are conducting a multinomial hypothesis test for the claim that all 5...
1A)
1B)
1C)
1D)
You are conducting a multinomial hypothesis test for the claim that all 5 categories are equally likely to be selected. Complete the table. Round to 3 decimal places. Observed Category Frequency Frequency Expected (0-E) E A 9 B 18 с 19 D 9 E 17 What is the chi-square test-statistic for this data? x2 = Report all answers accurate to three decimal places. You are conducting a multinomial hypothesis test for the claim that all 5...
 You are conducting a
multinomial Goodness of Fit hypothesis test for the claim that the
4 categories occur with the following frequencies: H o : p A = 0.3
; p B = 0.1 ; p C = 0.1 ; p D = 0.5 Complete the table. Report all
answers accurate to three decimal places. Category Observed
Frequency Expected Frequency A 50 B 38 C 19 D 66 What is the
chi-square test-statistic for this data? χ 2 = What...
You are conducting a
multinomial Goodness of Fit hypothesis test for the claim that the
4 categories occur with the following frequencies: H o : p A = 0.3
; p B = 0.1 ; p C = 0.1 ; p D = 0.5 Complete the table. Report all
answers accurate to three decimal places. Category Observed
Frequency Expected Frequency A 50 B 38 C 19 D 66 What is the
chi-square test-statistic for this data? χ 2 = What...
 Please explain by using the
TI-83 calculator if possible.
You are conducting a multinomial hypothesis test for the claim that the 4 categories occur with the following frequencies: H: PA = 0.25; PB = 0.4; Pc = 0.1; PD = 0.25 Observed Category Frequency 42 ID 27 What is the chi-square test-statistic for this data? x² = 1 Report all answers accurate to three decimal places.
Please explain by using the
TI-83 calculator if possible.
You are conducting a multinomial hypothesis test for the claim that the 4 categories occur with the following frequencies: H: PA = 0.25; PB = 0.4; Pc = 0.1; PD = 0.25 Observed Category Frequency 42 ID 27 What is the chi-square test-statistic for this data? x² = 1 Report all answers accurate to three decimal places.
 You are conducting a multinomial Goodness of Fit hypothesis test for the claim that the 4 categories occur with the following frequencies Complete the table. Report all answers accurate to three decimal places Observed Expected Category Frequency Frequency A 51 B 30 С 137 D 41 What is the chi-square test-statistic for this data? What is the P-Value? P-Value- For significance level alpha 0.05, What would be the conclusion of this hypothesis test? O Fail to reject the Null Hypothesis...
 1A)
1B)
1C)
1D)
You are conducting a multinomial Goodness of Fit hypothesis test for the claim that the 4 categories occur with the following frequencies: H:PA = 0.1; P = 0.3; Pc = 0.1; Pp = 0.5 Complete the table. Report all answers accurate to three decimal places. Observed Expected Category Frequency Frequency А 17 B 43 с 12 D 48 What is the chi-square test-statistic for this data? x = What is the P-value? P-Value = For significance...
1A)
1B)
1C)
1D)
You are conducting a multinomial Goodness of Fit hypothesis test for the claim that the 4 categories occur with the following frequencies: H:PA = 0.1; P = 0.3; Pc = 0.1; Pp = 0.5 Complete the table. Report all answers accurate to three decimal places. Observed Expected Category Frequency Frequency А 17 B 43 с 12 D 48 What is the chi-square test-statistic for this data? x = What is the P-value? P-Value = For significance...
Most questions answered within 3 hours.
-
The three key cash-related activities of a firm are
operational activities, non-current activities and financing
activities....
asked 1 hour ago -
what statement accurately depicts the similarities in
requirements between payroll and human resources function
asked 2 hours ago -
Calculate the volume integral of the function T=z^2 over the
tetrahedron with corners (0,0,0), (1,0,0), (0,1,0),...
asked 4 hours ago -
I propose to you a game. You roll 2 dice. If the sum of the
numbers...
asked 5 hours ago -
Select the most likely lattice types for each of the following
salts: (a) BeF2; (b) CaO;...
asked 5 hours ago -
a
ball is thrown downward with velocity of 10m/s. calculate the final
velocity if it reaches...
asked 6 hours ago -
How many grams of ice at -15°C must be added to 705 grams of
water that...
asked 7 hours ago -
2. Balance sheet
The balance sheet provides a snapshot of the financial condition
of a company....
asked 8 hours ago -
In week 1 of the chemical equilibrium experiment, you and your
lab team will create a...
asked 8 hours ago -
Identify and describe five (5) characteristics of a good KM
measurement system. Be sure to include...
asked 8 hours ago -
What are at least five (5) workplace wellness best practices for
a successful wellness program? Explain...
asked 8 hours ago -
A pharmaceutical company is testing a new drug. Of the 110
people that received the drug,...
asked 9 hours ago