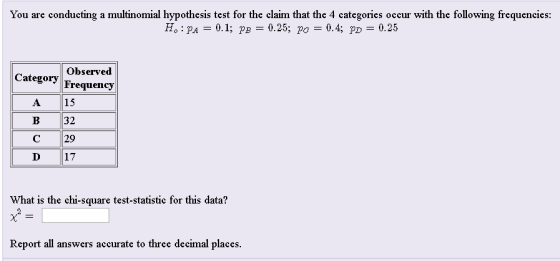
You are conducting a multinomial hypothesis test for the claim that the 4 categories occur with the following frequencies: H o : p A = 0.1 ; p B = 0.25 ; p C = 0.4 ; p D = 0.25
Calculate the test by showing the steps on the calculator.
Homework Answers


Add Answer to:
You are conducting a multinomial hypothesis test for the claim that the 4 categories occur with...
You are conducting a multinomial hypothesis test for the claim that the 4 categories occur with...
You are conducting a multinomial hypothesis test for the claim that the 4 categories occur with the following frequencies: H o : p A = 0.4 ; p B = 0.1 ; p C = 0.25 ; p D = 0.25 Category Observed Frequency A 52 B 35 C 18 D 26 What is the chi-square test-statistic for this data? χ 2 = 44.646 Incorrect Report all answers accurate to three decimal places.
You are conducting a multinomial hypothesis test for the claim that the 4 categories occur with...
You are conducting a multinomial hypothesis test for the claim that the 4 categories occur with the following frequencies: HoHo : pA=0.15pA=0.15; pB=0.3pB=0.3; pC=0.4pC=0.4; pD=0.15pD=0.15 Category Observed Frequency A 39 B 53 C 55 D 26 What is the chi-square test-statistic for this data? χ2=χ2=
You are conducting a multinomial hypothesis test for the claim that the 4 categories occur with...
 You are conducting a multinomial hypothesis test for the claim
that the 4 categories occur with the following frequencies:
HoHo :
pA=0.15pA=0.15; pB=0.3pB=0.3; pC=0.4pC=0.4; pD=0.15pD=0.15
Category
Observed
Frequency
A
39
B
53
C
55
D
26
What is the chi-square test-statistic for this data?
χ2=χ2=
You are conducting a multinomial hypothesis test for the claim
that the 4 categories occur with the following frequencies:
HoHo :
pA=0.15pA=0.15; pB=0.3pB=0.3; pC=0.4pC=0.4; pD=0.15pD=0.15
Category
Observed
Frequency
A
39
B
53
C
55
D
26
What is the chi-square test-statistic for this data?
χ2=χ2=
1A) 1B) 1C) 1D) You are conducting a multinomial hypothesis test for the claim that all...
 1A)
1B)
1C)
1D)
You are conducting a multinomial hypothesis test for the claim that all 5 categories are equally likely to be selected. Complete the table. Round to 3 decimal places. Observed Category Frequency Frequency Expected (0-E) E A 9 B 18 с 19 D 9 E 17 What is the chi-square test-statistic for this data? x2 = Report all answers accurate to three decimal places. You are conducting a multinomial hypothesis test for the claim that all 5...
1A)
1B)
1C)
1D)
You are conducting a multinomial hypothesis test for the claim that all 5 categories are equally likely to be selected. Complete the table. Round to 3 decimal places. Observed Category Frequency Frequency Expected (0-E) E A 9 B 18 с 19 D 9 E 17 What is the chi-square test-statistic for this data? x2 = Report all answers accurate to three decimal places. You are conducting a multinomial hypothesis test for the claim that all 5...
You are conducting a multinomial Goodness of Fit hypothesis test for the claim that the 4 categor...
 You are conducting a
multinomial Goodness of Fit hypothesis test for the claim that the
4 categories occur with the following frequencies: H o : p A = 0.3
; p B = 0.1 ; p C = 0.1 ; p D = 0.5 Complete the table. Report all
answers accurate to three decimal places. Category Observed
Frequency Expected Frequency A 50 B 38 C 19 D 66 What is the
chi-square test-statistic for this data? χ 2 = What...
You are conducting a
multinomial Goodness of Fit hypothesis test for the claim that the
4 categories occur with the following frequencies: H o : p A = 0.3
; p B = 0.1 ; p C = 0.1 ; p D = 0.5 Complete the table. Report all
answers accurate to three decimal places. Category Observed
Frequency Expected Frequency A 50 B 38 C 19 D 66 What is the
chi-square test-statistic for this data? χ 2 = What...
Please explain by using the TI-83 calculator if possible. You are conducting a multinomial hypothesis test...
 Please explain by using the
TI-83 calculator if possible.
You are conducting a multinomial hypothesis test for the claim that the 4 categories occur with the following frequencies: H: PA = 0.25; PB = 0.4; Pc = 0.1; PD = 0.25 Observed Category Frequency 42 ID 27 What is the chi-square test-statistic for this data? x² = 1 Report all answers accurate to three decimal places.
Please explain by using the
TI-83 calculator if possible.
You are conducting a multinomial hypothesis test for the claim that the 4 categories occur with the following frequencies: H: PA = 0.25; PB = 0.4; Pc = 0.1; PD = 0.25 Observed Category Frequency 42 ID 27 What is the chi-square test-statistic for this data? x² = 1 Report all answers accurate to three decimal places.
You are conducting a multinomial Goodness of Fit hypothesis test for the claim that the 4...
You are conducting a multinomial Goodness of Fit hypothesis test for the claim that the 4 categories occur with the following frequencies: Ho : pA=0.3; pB=0.15; pC=0.15; pD=0.4 Complete the table. Report all answers accurate to three decimal places. Category Observed Frequency Expected Frequency A 29 B 41 C 12 D 53 What is the chi-square test-statistic for this data? χ2= What is the P-Value? P-Value = For significance level alpha 0.05, what would be the conclusion of this hypothesis...
You are conducting a multinomial Goodness of Fit hypothesis test for the claim that the 4...
You are conducting a multinomial Goodness of Fit hypothesis test for the claim that the 4 categories occur with the following frequencies: HoHo : pA=0.4pA=0.4; pB=0.1pB=0.1; pC=0.2pC=0.2; pD=0.3pD=0.3 Complete the table. Report all answers accurate to three decimal places. Category Observed Frequency Expected Frequency Residual A 50 B 10 C 16 D 33 What is the chi-square test-statistic for this data? χ2=χ2= For significance level alpha 0.1, what is the chi-square Critical Value? Critical Value = What would be the conclusion of this...
You are conducting a multinomial Goodness of Fit hypothesis test for the claim that the 4...
 You are conducting a multinomial Goodness of Fit hypothesis test for the claim that the 4 categories occur with the following frequencies Complete the table. Report all answers accurate to three decimal places Observed Expected Category Frequency Frequency A 51 B 30 С 137 D 41 What is the chi-square test-statistic for this data? What is the P-Value? P-Value- For significance level alpha 0.05, What would be the conclusion of this hypothesis test? O Fail to reject the Null Hypothesis...
1A) 1B) 1C) 1D) You are conducting a multinomial Goodness of Fit hypothesis test for the...
 1A)
1B)
1C)
1D)
You are conducting a multinomial Goodness of Fit hypothesis test for the claim that the 4 categories occur with the following frequencies: H:PA = 0.1; P = 0.3; Pc = 0.1; Pp = 0.5 Complete the table. Report all answers accurate to three decimal places. Observed Expected Category Frequency Frequency А 17 B 43 с 12 D 48 What is the chi-square test-statistic for this data? x = What is the P-value? P-Value = For significance...
1A)
1B)
1C)
1D)
You are conducting a multinomial Goodness of Fit hypothesis test for the claim that the 4 categories occur with the following frequencies: H:PA = 0.1; P = 0.3; Pc = 0.1; Pp = 0.5 Complete the table. Report all answers accurate to three decimal places. Observed Expected Category Frequency Frequency А 17 B 43 с 12 D 48 What is the chi-square test-statistic for this data? x = What is the P-value? P-Value = For significance...
 You are conducting a multinomial hypothesis test for the claim
that the 4 categories occur with the following frequencies:
HoHo :
pA=0.15pA=0.15; pB=0.3pB=0.3; pC=0.4pC=0.4; pD=0.15pD=0.15
Category
Observed
Frequency
A
39
B
53
C
55
D
26
What is the chi-square test-statistic for this data?
χ2=χ2=
You are conducting a multinomial hypothesis test for the claim
that the 4 categories occur with the following frequencies:
HoHo :
pA=0.15pA=0.15; pB=0.3pB=0.3; pC=0.4pC=0.4; pD=0.15pD=0.15
Category
Observed
Frequency
A
39
B
53
C
55
D
26
What is the chi-square test-statistic for this data?
χ2=χ2=
 1A)
1B)
1C)
1D)
You are conducting a multinomial hypothesis test for the claim that all 5 categories are equally likely to be selected. Complete the table. Round to 3 decimal places. Observed Category Frequency Frequency Expected (0-E) E A 9 B 18 с 19 D 9 E 17 What is the chi-square test-statistic for this data? x2 = Report all answers accurate to three decimal places. You are conducting a multinomial hypothesis test for the claim that all 5...
1A)
1B)
1C)
1D)
You are conducting a multinomial hypothesis test for the claim that all 5 categories are equally likely to be selected. Complete the table. Round to 3 decimal places. Observed Category Frequency Frequency Expected (0-E) E A 9 B 18 с 19 D 9 E 17 What is the chi-square test-statistic for this data? x2 = Report all answers accurate to three decimal places. You are conducting a multinomial hypothesis test for the claim that all 5...
 You are conducting a
multinomial Goodness of Fit hypothesis test for the claim that the
4 categories occur with the following frequencies: H o : p A = 0.3
; p B = 0.1 ; p C = 0.1 ; p D = 0.5 Complete the table. Report all
answers accurate to three decimal places. Category Observed
Frequency Expected Frequency A 50 B 38 C 19 D 66 What is the
chi-square test-statistic for this data? χ 2 = What...
You are conducting a
multinomial Goodness of Fit hypothesis test for the claim that the
4 categories occur with the following frequencies: H o : p A = 0.3
; p B = 0.1 ; p C = 0.1 ; p D = 0.5 Complete the table. Report all
answers accurate to three decimal places. Category Observed
Frequency Expected Frequency A 50 B 38 C 19 D 66 What is the
chi-square test-statistic for this data? χ 2 = What...
 Please explain by using the
TI-83 calculator if possible.
You are conducting a multinomial hypothesis test for the claim that the 4 categories occur with the following frequencies: H: PA = 0.25; PB = 0.4; Pc = 0.1; PD = 0.25 Observed Category Frequency 42 ID 27 What is the chi-square test-statistic for this data? x² = 1 Report all answers accurate to three decimal places.
Please explain by using the
TI-83 calculator if possible.
You are conducting a multinomial hypothesis test for the claim that the 4 categories occur with the following frequencies: H: PA = 0.25; PB = 0.4; Pc = 0.1; PD = 0.25 Observed Category Frequency 42 ID 27 What is the chi-square test-statistic for this data? x² = 1 Report all answers accurate to three decimal places.
 You are conducting a multinomial Goodness of Fit hypothesis test for the claim that the 4 categories occur with the following frequencies Complete the table. Report all answers accurate to three decimal places Observed Expected Category Frequency Frequency A 51 B 30 С 137 D 41 What is the chi-square test-statistic for this data? What is the P-Value? P-Value- For significance level alpha 0.05, What would be the conclusion of this hypothesis test? O Fail to reject the Null Hypothesis...
 1A)
1B)
1C)
1D)
You are conducting a multinomial Goodness of Fit hypothesis test for the claim that the 4 categories occur with the following frequencies: H:PA = 0.1; P = 0.3; Pc = 0.1; Pp = 0.5 Complete the table. Report all answers accurate to three decimal places. Observed Expected Category Frequency Frequency А 17 B 43 с 12 D 48 What is the chi-square test-statistic for this data? x = What is the P-value? P-Value = For significance...
1A)
1B)
1C)
1D)
You are conducting a multinomial Goodness of Fit hypothesis test for the claim that the 4 categories occur with the following frequencies: H:PA = 0.1; P = 0.3; Pc = 0.1; Pp = 0.5 Complete the table. Report all answers accurate to three decimal places. Observed Expected Category Frequency Frequency А 17 B 43 с 12 D 48 What is the chi-square test-statistic for this data? x = What is the P-value? P-Value = For significance...
Most questions answered within 3 hours.
-
When an object moves through a fluid, the fluid exerts a viscous
force F on the...
asked 1 hour ago -
Why did the observed chemistry of thallium mislead Mendelev to
place the group 13 element (Tl)...
asked 2 hours ago -
A sine wave signal is displayed on the screen of an
oscilloscope. 6 peak-to-peak divisions are...
asked 4 hours ago -
a
1500 kg car accelerates from 0 to 25 m / s in 21.0s. How much...
asked 5 hours ago -
Calculate the molarity of each of the following solutions:
(a) 30.5 g of ethanol (C2H5OH) in...
asked 5 hours ago -
1 Refer to the build-borrow-or-buy framework as a decision tree
for the Adidas company. Identify a...
asked 6 hours ago -
Problem 2: The Problem of Social Cost. A Rancher and Farmer live
side-by-side to each other....
asked 7 hours ago -
a uniform bar of weight 40N is 4 meter long. weights
on 60N and 100N are...
asked 7 hours ago -
Define Diet counceling? What are the
responsibilities of a counselor?
asked 9 hours ago -
Hey im just confused about how to put the ' A angle n' and ' S...
asked 9 hours ago -
A short essay about the WSJ article on Oreo versus Hydrox.
asked 9 hours ago -
##8. A program contains the following function definition:
##def cube(num):
##return num * num * num...
asked 9 hours ago