
Homework Answers
The exceedance probability of the event is obtained by the use of empirical formula known as plotting position. Several plotting formulas were developed and some of them are given below:
| Method | P (probability) |
| California |  |
| Hazen |  |
| Weibull |  |
| Chegodayev |  |
| Blom |  |
m = rank assigned to the data after arranging them in the descending order of magnitude
N = number of records
Weibull formula is the most widely used empirical plotting position formula
(a) Discharge is arranged in descending order and ranks (m) has been assigned. Probability is calculated using Weibull's formula, P= m/N+1, where N= 11 in this case. Reccurence Interval T = 1/P.
| m | Discharge (cfs) | P=m/N+1 | T=1/P |
| 1 | 2030 | 0.083333333 | 12 |
| 2 | 1600 | 0.166666667 | 6 |
| 3 | 1480 | 0.25 | 4 |
| 4 | 1380 | 0.333333333 | 3 |
| 5 | 1330 | 0.416666667 | 2.4 |
| 6 | 1280 | 0.5 | 2 |
| 7 | 1080 | 0.583333333 | 1.714285714 |
| 8 | 890 | 0.666666667 | 1.5 |
| 9 | 889 | 0.75 | 1.333333333 |
| 10 | 800 | 0.833333333 | 1.2 |
| 11 | 692 | 0.916666667 | 1.090909091 |
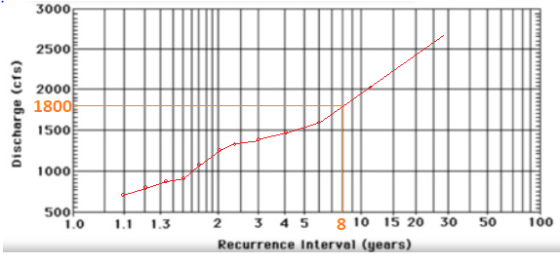
The flood frequency curve has been plotted as shown in figure:

(b) For a flood having return period T = 20 years, From the figure, the corresponding discharge value is obtained as Q = 2430 cfs (The graph has been extrapolated)

For a flood having discharge Q = 1800cfs, From the figure, the corresponding reccurence interval = 8 years
(c) Reccurence Interval T = 20 years
Probability of occurence of event p = 1 / Reccurence Interval = 1/T = 1/20
q = 1- p = 1- 1/20 = 19/20
The probability(P) of occurence of the event r times in n successive years is given by:

The probability of occurence of the flood exactly twice in next 50 years :

Add Answer to:
please show all work.
The maximum annual peak discharges of the Wonder River for eleven years...
Table 1 below lists the annual peak discharge for the Ogeechee River, located on the coastal...
 Table 1 below lists the annual peak discharge for the Ogeechee River, located on the coastal plain of Georgia. Total number of observations are 25. (1) (2) Annual Peak Discharge (cfs) (4) Recurrence Interval (RI) (5) Chance/Probability of occurrence in any given year (%| (3 Rank (M) Year 1974 9,000 1975 16,200 1976 7,720 1977 11,500 1978 17,300 1979 18,000 1980 27,900 1981 6,600 8,320 1982 1983 10,000 1984 6,560 1985 8,600 1986 8,200 1987 16,500 1988 2,700 5,030 1989...
11.14 The peak-flow data on an annual basis from Cedar River near Austin, MN, are listed...
 11.14 The peak-flow data on an annual basis from Cedar River near Austin, MN, are listed in the following table. Plot the flood-frequency curve on lognormal probability paper. Determine the (a) magnitude of a flood having a return period of 100 years (probability of 1%), and (b) probability of a flow of 100 cfs. Peak- flow cfs 7750 5440 Peak- flow cfs Peak- flow cfs Peak- flow cfs Year Year Year 1991 979 3880 2003 8690 1992 2004 3580 1993...
The record of average yearly flow for 15 years of a river is given in table-1....
 The record of average yearly flow for 15 years of a river is
given in table-1. If the available head is 14 m, construct the flow
duration curve and power duration curve for the river.
1 Table-1 S. No. 3 4 5 Year 1980 1981 1982 1983 1984 Flow (Cumecs) 500 665 550 479 875 6 1985 655 7 1986 1000 8 1987 1250 9 1988 900 10 1989 700 11 1990 850 12 1991 1050 13 1992 985 14...
The record of average yearly flow for 15 years of a river is
given in table-1. If the available head is 14 m, construct the flow
duration curve and power duration curve for the river.
1 Table-1 S. No. 3 4 5 Year 1980 1981 1982 1983 1984 Flow (Cumecs) 500 665 550 479 875 6 1985 655 7 1986 1000 8 1987 1250 9 1988 900 10 1989 700 11 1990 850 12 1991 1050 13 1992 985 14...
please show all work. Recent flooding on the Big Bad River at Goodtown has motivated the...
 please show all work.
Recent flooding on the Big Bad River at Goodtown has motivated the community to reconsider building a flood levee. A nearby stream gage on the river has a 60-year record. The ranked sample of annual maximum peak discharges are: Rank Peak Discharge (cfs) 1 5850 2 4120 4020 3 58 59 60 410 390 200 The 3rd largest flood (shown above) occurred in the past year. What is the estimated return period for the 3rd largest...
please show all work.
Recent flooding on the Big Bad River at Goodtown has motivated the community to reconsider building a flood levee. A nearby stream gage on the river has a 60-year record. The ranked sample of annual maximum peak discharges are: Rank Peak Discharge (cfs) 1 5850 2 4120 4020 3 58 59 60 410 390 200 The 3rd largest flood (shown above) occurred in the past year. What is the estimated return period for the 3rd largest...
Please check out these directions before the pictures! I hope someone is able to help! Thank...
 Please check out these directions before the pictures! I hope
someone is able to help! Thank you!
11.14 Empirical method. Plot (Q vs. P)data.
Correction to (b) probability of a flow of 1000 cfs
11.15 Use theoretical method (frequency factor).
Plot the flood-freq. curve (Q vs. P)theory.
+ Repeat (a) and (b) in Prob. 11.14.
These are the answers BEFROE using the constraints listed
above. I thought I’d include them as a reference.
rhe neak-flow data on an annual basis...
Please check out these directions before the pictures! I hope
someone is able to help! Thank you!
11.14 Empirical method. Plot (Q vs. P)data.
Correction to (b) probability of a flow of 1000 cfs
11.15 Use theoretical method (frequency factor).
Plot the flood-freq. curve (Q vs. P)theory.
+ Repeat (a) and (b) in Prob. 11.14.
These are the answers BEFROE using the constraints listed
above. I thought I’d include them as a reference.
rhe neak-flow data on an annual basis...
Please clearly label the graphs and show all the work. Thank you :) 2. Economic fluctuations...
 Please clearly label
the graphs and show all the work. Thank you :)
2. Economic fluctuations and growth The following table shows data on a hypothetical country's real GDP from 1980 through 1988: Year 1980 1981 1982 1983 1984 1985 1986 1987 1988 Real GDP (Billions of Dollars) 465 475 480 505 500 485 490 500 505 The green line on the following graph shows the economy's long-term growth trend Use the blue points (circle symbol) to plot the real...
Please clearly label
the graphs and show all the work. Thank you :)
2. Economic fluctuations and growth The following table shows data on a hypothetical country's real GDP from 1980 through 1988: Year 1980 1981 1982 1983 1984 1985 1986 1987 1988 Real GDP (Billions of Dollars) 465 475 480 505 500 485 490 500 505 The green line on the following graph shows the economy's long-term growth trend Use the blue points (circle symbol) to plot the real...
 Table 1 below lists the annual peak discharge for the Ogeechee River, located on the coastal plain of Georgia. Total number of observations are 25. (1) (2) Annual Peak Discharge (cfs) (4) Recurrence Interval (RI) (5) Chance/Probability of occurrence in any given year (%| (3 Rank (M) Year 1974 9,000 1975 16,200 1976 7,720 1977 11,500 1978 17,300 1979 18,000 1980 27,900 1981 6,600 8,320 1982 1983 10,000 1984 6,560 1985 8,600 1986 8,200 1987 16,500 1988 2,700 5,030 1989...
 11.14 The peak-flow data on an annual basis from Cedar River near Austin, MN, are listed in the following table. Plot the flood-frequency curve on lognormal probability paper. Determine the (a) magnitude of a flood having a return period of 100 years (probability of 1%), and (b) probability of a flow of 100 cfs. Peak- flow cfs 7750 5440 Peak- flow cfs Peak- flow cfs Peak- flow cfs Year Year Year 1991 979 3880 2003 8690 1992 2004 3580 1993...
 The record of average yearly flow for 15 years of a river is
given in table-1. If the available head is 14 m, construct the flow
duration curve and power duration curve for the river.
1 Table-1 S. No. 3 4 5 Year 1980 1981 1982 1983 1984 Flow (Cumecs) 500 665 550 479 875 6 1985 655 7 1986 1000 8 1987 1250 9 1988 900 10 1989 700 11 1990 850 12 1991 1050 13 1992 985 14...
The record of average yearly flow for 15 years of a river is
given in table-1. If the available head is 14 m, construct the flow
duration curve and power duration curve for the river.
1 Table-1 S. No. 3 4 5 Year 1980 1981 1982 1983 1984 Flow (Cumecs) 500 665 550 479 875 6 1985 655 7 1986 1000 8 1987 1250 9 1988 900 10 1989 700 11 1990 850 12 1991 1050 13 1992 985 14...
 please show all work.
Recent flooding on the Big Bad River at Goodtown has motivated the community to reconsider building a flood levee. A nearby stream gage on the river has a 60-year record. The ranked sample of annual maximum peak discharges are: Rank Peak Discharge (cfs) 1 5850 2 4120 4020 3 58 59 60 410 390 200 The 3rd largest flood (shown above) occurred in the past year. What is the estimated return period for the 3rd largest...
please show all work.
Recent flooding on the Big Bad River at Goodtown has motivated the community to reconsider building a flood levee. A nearby stream gage on the river has a 60-year record. The ranked sample of annual maximum peak discharges are: Rank Peak Discharge (cfs) 1 5850 2 4120 4020 3 58 59 60 410 390 200 The 3rd largest flood (shown above) occurred in the past year. What is the estimated return period for the 3rd largest...
 Please check out these directions before the pictures! I hope
someone is able to help! Thank you!
11.14 Empirical method. Plot (Q vs. P)data.
Correction to (b) probability of a flow of 1000 cfs
11.15 Use theoretical method (frequency factor).
Plot the flood-freq. curve (Q vs. P)theory.
+ Repeat (a) and (b) in Prob. 11.14.
These are the answers BEFROE using the constraints listed
above. I thought I’d include them as a reference.
rhe neak-flow data on an annual basis...
Please check out these directions before the pictures! I hope
someone is able to help! Thank you!
11.14 Empirical method. Plot (Q vs. P)data.
Correction to (b) probability of a flow of 1000 cfs
11.15 Use theoretical method (frequency factor).
Plot the flood-freq. curve (Q vs. P)theory.
+ Repeat (a) and (b) in Prob. 11.14.
These are the answers BEFROE using the constraints listed
above. I thought I’d include them as a reference.
rhe neak-flow data on an annual basis...
 Please clearly label
the graphs and show all the work. Thank you :)
2. Economic fluctuations and growth The following table shows data on a hypothetical country's real GDP from 1980 through 1988: Year 1980 1981 1982 1983 1984 1985 1986 1987 1988 Real GDP (Billions of Dollars) 465 475 480 505 500 485 490 500 505 The green line on the following graph shows the economy's long-term growth trend Use the blue points (circle symbol) to plot the real...
Please clearly label
the graphs and show all the work. Thank you :)
2. Economic fluctuations and growth The following table shows data on a hypothetical country's real GDP from 1980 through 1988: Year 1980 1981 1982 1983 1984 1985 1986 1987 1988 Real GDP (Billions of Dollars) 465 475 480 505 500 485 490 500 505 The green line on the following graph shows the economy's long-term growth trend Use the blue points (circle symbol) to plot the real...
Most questions answered within 3 hours.
-
Based on the range, which of the following sets of scores has
the greatest variability? 3,...
asked 39 minutes ago -
Ripples in a pond travel at a velocity of 3 m/s with one peak
passing a...
asked 29 minutes ago -
A man stands on the roof of a building of height 13.0 mm and
throws a...
asked 35 minutes ago -
The extent to which assets are financed by borrowed funds and
other liabilities is indicated by:...
asked 1 hour ago -
Explain in detail
Germany is the fifth largest economy
explain what goods and services Germany specializes...
asked 1 hour ago -
The density of platinum is 21.45 g/mL. If a cube of platinum
with a mass of...
asked 1 hour ago -
Accounts Receivable
Sales
A/R Posting
Extended Sales Invoice
Packing Slip
Compare invoice to packing slip 2...
asked 1 hour ago -
Michaella, age 23, is a full-time law student and is claimed by
her parents as a...
asked 2 hours ago -
Why are polymers not typically casted into products?
asked 2 hours ago -
When rolling a die 129 times, what is the probability of rolling
a 6 no more...
asked 2 hours ago -
4. A call option currently sells for $7.75. It has a strike
price of $85 and...
asked 2 hours ago -
1.
You need to prepare 10.0 liters of an acid aqueous solution with a
pH of...
asked 2 hours ago