1. Use the regression equation to calculate the number of Electoral votes that a state with a population of 1,000,000 would have. Since our units of population are in thousands, substitute x=1000 into the formula, find the value of y and round to the nearest whole number (since it is measuring electoral votes). Do this in Excel using what you know about Excel formulas.
2. Is this meaningful as a state population? Why or why not?
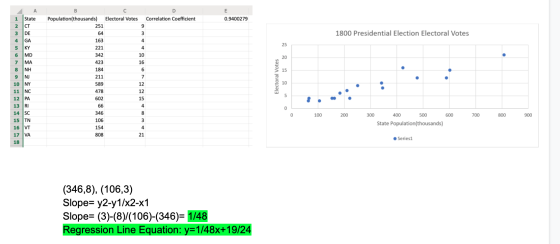
3. Discuss, briefly, what the value of the correlation coefficient (and the scatter plot) reveals about the relationship between population and electoral votes. (in other words, is it a strong or weak correlation, and why?)
4. Many states did not exist in 1800. Find three states which had no electoral votes in 1800 and write down the first presidential election in which they voted. (You will probably need to look this up on the internet)
Homework Answers
1. y = 1/48x + 19/24
Now, x = 1000 and as it is in thousands
so, y = 1000/48 + 19/24= 12.625 electoral votes
In excel:
=A2/48+19/24
where A2 = 1000 (x)
2. Yes, it is meaningful because higher the population , higher should be the no. of votes or electoral votes that one can cast and to add to that coefficient of x is positive and from scatter plot, we see upward positive relationship.
For a 1000 people in population , there are 1000/48 = 20.83 votes.
3. Correlation = 0.94 (very high i.e, close to 1 , strong , positive) and this relationship is represented by scatterplot as the line is upward and straight line.
4. I have no idea about your country you can just google the stated that got established after 1800 (any 3) and google them seperately once you know the names and I am sure wikipedia page will tell u the first presidential election time period.
Please rate my answer and comment for doubt.
Add Answer to:
1. Use the regression equation to calculate the number of
Electoral votes that a state with...
E D Correlation coefficient 0.9400279 المة 1800 Presidential Election Electoral Votes 25 20 15 A 1...
 E D Correlation coefficient 0.9400279 المة 1800 Presidential Election Electoral Votes 25 20 15 A 1 State 2. CT 3 DE 4 GA 5 KY 6 MD 7 MA 8 NH 9 NJ 10 NY 11 NC 12 IPA 13 RI 14 SC 15 TN 16 VT 17 VA 18 B С Population(thousands) Electoral Votes 251 9 64 163 4 221 4 342 10 423 16 184 6 211 7 589 12 478 12 602 15 66 4 346 8...
Question 10 (1 point) Georgia Votes 2000 - The 2000 presidential election between Al Gore and...
 Question 10 (1 point) Georgia Votes 2000 - The 2000 presidential election between Al Gore and George W. Bush was the closest presidential election in the history of the United States. A social historian is investigating the relationship between race and voting results. For a random sample of 50 counties in the state of Georgia, the historian obtains the percentage of county residents who were African American (AA), and the percentage of ballots cast for Al Gore. Percentage AA is...
Use the regression equation to predict the number of motor vehicle fatalities in a western state...
Use the regression equation to predict the number of motor vehicle fatalities in a western state with a population of 4 million people (40 hundred thousand people). Does this answer seem reasonable based on the given data? Why or why not? Population (hundreds of thousands) = 3.3277772 + 0.054110317 Motor Vehicle Fatalities Motor Vehicle Fatalities Population (hundreds of thousands) 87 7 1117 50 4078 361 742 47 119 13 264 14 270 9 381 24 449 19 436 36 328...
The number of domestic and imported retail car sales (in hundreds of thousands) in the United...
The number of domestic and imported retail car sales (in hundreds of thousands) in the United States for a period of 9 years are given in the following table. Year Domestic Car Sales Imported Car Sales Year 1 69.8 17.2 Year 2 68.3 20.1 Year 3 63.2 21.1 Year 4 58.8 22.4 Year 5 55.3 20.8 Year 6 53.6 21.4 Year 7 54.8 21.9 Year 8 54.4 23.3 Year 9 52.5 23.8 (a) Letting x = the number of domestic...
Time Period t Daily Sales 1 59 2 56 3 92 4 78 5 63 6...
Time Period t Daily Sales 1 59 2 56 3 92 4 78 5 63 6 75 7 81 8 65 9 99 10 86 11 72 12 89 13 107 14 104 15 93 16 106 17 104 18 124 19 110 20 106 Given the Data Above for the first 20 days Daily Sales of a new restaurant, use a Regression Tool like DATA ANALYSIS in Excel and find each of the following: Slope of Regression Equation =...
from part 5-12 plz dont do 1-4 BUNUS Assignment! A Sample Data AnalySIS III Licer Please...
 from part 5-12 plz dont do 1-4
BUNUS Assignment! A Sample Data AnalySIS III Licer Please answer all of the following questions. Make sure you show all your work, providing snapshots from Excel as well as listing all formulas and relevant explanation, as needed. We are interested in exploring the relationship between the income of professors (measured in thousands of dollars) and the number of years they have been employed by the university. We collect the following data from eight...
from part 5-12 plz dont do 1-4
BUNUS Assignment! A Sample Data AnalySIS III Licer Please answer all of the following questions. Make sure you show all your work, providing snapshots from Excel as well as listing all formulas and relevant explanation, as needed. We are interested in exploring the relationship between the income of professors (measured in thousands of dollars) and the number of years they have been employed by the university. We collect the following data from eight...
JUST NEED HELP WITH J AND K THANK YOU!!!:) Assignment Problem: Matt Profitt, an MBA student,...
JUST NEED HELP WITH J AND K THANK YOU!!!:) Assignment Problem: Matt Profitt, an MBA student, is studying companies that are going public for the first time. He is curious about whether or not there is a significant relationship between the size of the offering (in millions of dollars) and the price per share. Size 108 4.4 3.5 8.6 139 228 47.5 5.5 175 12 51 66 Price 12 4 5 6 13 19 8.5 5 15 6 12 12 a. Develop the appropriate scatterplot for the two variables in the Excel spreadsheet. b. Based upon the visual inspection of the plot, what type...
part 1 is done need help with part 2 please Regression and Correlation Part 1 -Hypothesis...
 part 1 is done need help with part 2 please
Regression and Correlation Part 1 -Hypothesis test for u a) Use the data provided Perform a complete hypothesis test (show all steps) of Ho: 4 = 42 Use a -.05 Word your conclusion clearly in plain English so that a 14-year-old would understand it. For this part of the assignment, we'll look to see if there's an association between the responses of your two numerical questions PART 2 - Regression...
part 1 is done need help with part 2 please
Regression and Correlation Part 1 -Hypothesis test for u a) Use the data provided Perform a complete hypothesis test (show all steps) of Ho: 4 = 42 Use a -.05 Word your conclusion clearly in plain English so that a 14-year-old would understand it. For this part of the assignment, we'll look to see if there's an association between the responses of your two numerical questions PART 2 - Regression...
Using simple regression, determine whether test scores are significantly related to sales performance. Use significance level...
 Using simple regression, determine whether test scores are
significantly related to sales performance. Use significance level
of 0.05%. Clearly interpret the slope (beta coefficient) and the
adjusted R squared value you obtained.
Using multiple regression, determine whether test scores and
number of months are significantly related to sales performance.
Use significance level of 0.05%. Clearly interpret the slopes (beta
coefficients) and the adjusted R squared value you obtained.
E ៥ដង А B c D 1 DATA SET FOR SALESFORCE PROBLEM...
Using simple regression, determine whether test scores are
significantly related to sales performance. Use significance level
of 0.05%. Clearly interpret the slope (beta coefficient) and the
adjusted R squared value you obtained.
Using multiple regression, determine whether test scores and
number of months are significantly related to sales performance.
Use significance level of 0.05%. Clearly interpret the slopes (beta
coefficients) and the adjusted R squared value you obtained.
E ៥ដង А B c D 1 DATA SET FOR SALESFORCE PROBLEM...
Chapter 12 Project: Linear Regression and Correlation Student Learning Outcomes: • The student will calculate and...
 Chapter 12 Project: Linear Regression and Correlation Student Learning Outcomes: • The student will calculate and construct the line of best fit between two variables. • The student will evaluate the relationship between two variables to determine if that relationship is significant Data The table below gives total fuel efficiency (in miles per gallon) and mass (in kilograms) of 20 new model cars with automatic transmissions. We will use this data to determine the relationship, if any, between the fuel...
 E D Correlation coefficient 0.9400279 المة 1800 Presidential Election Electoral Votes 25 20 15 A 1 State 2. CT 3 DE 4 GA 5 KY 6 MD 7 MA 8 NH 9 NJ 10 NY 11 NC 12 IPA 13 RI 14 SC 15 TN 16 VT 17 VA 18 B С Population(thousands) Electoral Votes 251 9 64 163 4 221 4 342 10 423 16 184 6 211 7 589 12 478 12 602 15 66 4 346 8...
 Question 10 (1 point) Georgia Votes 2000 - The 2000 presidential election between Al Gore and George W. Bush was the closest presidential election in the history of the United States. A social historian is investigating the relationship between race and voting results. For a random sample of 50 counties in the state of Georgia, the historian obtains the percentage of county residents who were African American (AA), and the percentage of ballots cast for Al Gore. Percentage AA is...
 from part 5-12 plz dont do 1-4
BUNUS Assignment! A Sample Data AnalySIS III Licer Please answer all of the following questions. Make sure you show all your work, providing snapshots from Excel as well as listing all formulas and relevant explanation, as needed. We are interested in exploring the relationship between the income of professors (measured in thousands of dollars) and the number of years they have been employed by the university. We collect the following data from eight...
from part 5-12 plz dont do 1-4
BUNUS Assignment! A Sample Data AnalySIS III Licer Please answer all of the following questions. Make sure you show all your work, providing snapshots from Excel as well as listing all formulas and relevant explanation, as needed. We are interested in exploring the relationship between the income of professors (measured in thousands of dollars) and the number of years they have been employed by the university. We collect the following data from eight...
 part 1 is done need help with part 2 please
Regression and Correlation Part 1 -Hypothesis test for u a) Use the data provided Perform a complete hypothesis test (show all steps) of Ho: 4 = 42 Use a -.05 Word your conclusion clearly in plain English so that a 14-year-old would understand it. For this part of the assignment, we'll look to see if there's an association between the responses of your two numerical questions PART 2 - Regression...
part 1 is done need help with part 2 please
Regression and Correlation Part 1 -Hypothesis test for u a) Use the data provided Perform a complete hypothesis test (show all steps) of Ho: 4 = 42 Use a -.05 Word your conclusion clearly in plain English so that a 14-year-old would understand it. For this part of the assignment, we'll look to see if there's an association between the responses of your two numerical questions PART 2 - Regression...
 Using simple regression, determine whether test scores are
significantly related to sales performance. Use significance level
of 0.05%. Clearly interpret the slope (beta coefficient) and the
adjusted R squared value you obtained.
Using multiple regression, determine whether test scores and
number of months are significantly related to sales performance.
Use significance level of 0.05%. Clearly interpret the slopes (beta
coefficients) and the adjusted R squared value you obtained.
E ៥ដង А B c D 1 DATA SET FOR SALESFORCE PROBLEM...
Using simple regression, determine whether test scores are
significantly related to sales performance. Use significance level
of 0.05%. Clearly interpret the slope (beta coefficient) and the
adjusted R squared value you obtained.
Using multiple regression, determine whether test scores and
number of months are significantly related to sales performance.
Use significance level of 0.05%. Clearly interpret the slopes (beta
coefficients) and the adjusted R squared value you obtained.
E ៥ដង А B c D 1 DATA SET FOR SALESFORCE PROBLEM...
 Chapter 12 Project: Linear Regression and Correlation Student Learning Outcomes: • The student will calculate and construct the line of best fit between two variables. • The student will evaluate the relationship between two variables to determine if that relationship is significant Data The table below gives total fuel efficiency (in miles per gallon) and mass (in kilograms) of 20 new model cars with automatic transmissions. We will use this data to determine the relationship, if any, between the fuel...
Most questions answered within 3 hours.
-
The Saunders Investment Bank has the following financing
outstanding.
Debt:
20,000 bonds with a coupon rate...
asked 2 minutes from now -
An object is 14 cm in front of a diverging lens that has a focal
length...
asked 1 minute from now -
This is subject of C++
Your program should read the file answers.dat.
This file contains the...
asked 1 minute ago -
Assume that p NAND q is logically equivalent to ¬(p ∧ q). Then,
(a) prove that...
asked 15 minutes ago -
Evaluate the following statements about anaerobic conditions as
true or false. For clarity’s sake, let’s assume...
asked 20 minutes ago -
Lagle Corporation has provided the following information:
Cost per Unit
Cost per Period
Direct materials
$...
asked 24 minutes ago -
On the Value Chain – Apple Inc.
a. Identify and discuss the business model that best...
asked 27 minutes ago -
an
ideal gas at 0°C consists of 1.0×10^23 atoms. 18 J of thermal
energy are added...
asked 29 minutes ago -
Create an email campaign for an item you typically purchase at
the grocery store.
asked 32 minutes ago -
Task 1:
Discuss the objectives of the ASEAN Free Trade Agreement
(AFTA) and its impacts on...
asked 41 minutes ago -
Which of the following is not one of the least squares
assumptions used in Stock and...
asked 45 minutes ago -
An economy has a labor endowment of 18 units. Good x has the
production function x...
asked 50 minutes ago