
Homework Answers
HYPOTHESIS TEST-
We have to perform Chi-square test for independence between two random variables education level and frequency of exercise for adults.
We have to test for null hypothesis

against the alternative hypothesis

Observed frequencies  are as follows.

Under null hypothesis, we obtain
expected frequencies  by multiplying corresponding row total and column total and
dividing it by grand total as follows.
by multiplying corresponding row total and column total and
dividing it by grand total as follows.

Our Chi-square test statistic is given by
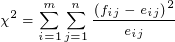
Here,
Number of rows 
Number of columns 
Corresponding calculations (chi square component for each cell, which are to be added later) are as follows.


Degrees of freedom 
 [Using R-code '1-pchisq(20.1115,9)']
Level of significance 
We reject our null hypothesis if

Here, we observe that 
So, we reject our null hypothesis.
ANSWERS-
A.
We have to perform Chi-square test for independence.
B.
Null hypothesis is
Alternative hypothesis is
C.
Test statistic is 
D.

E.
Based on the given data we can conclude that there is significant evidence that education level and frequency of exercise for adults are not independent.
Add Answer to:
A researcher wants to find out if educaiton level and frequency of exercise for adults are...
18. A researcher claims that more than 75% of the adults believe in global warming, Mimi conducte...
 18. A researcher claims that more than 75% of the adults believe in global warming, Mimi conducted a survey on a random sample of 300 adults. The survey showed that 240 adults in the sample believe in global warming. Assume Mimi wants to use a 0.05 significance level to test the researcher's claim. (a) What is the appropriate hypothesis test to use for this analysis? Please identify and explain (b) Identify the null hypothesis and the alternative hypothesis. why it...
A researcher claims that more than 75% of the adults believe in global warming. Ryan conducted...
A researcher claims that more than 75% of the adults believe in global warming. Ryan conducted a survey on a random sample of 200 adults. The survey showed that 155 adults in the sample believe in global warming. Assume Ryan wants to use a 0.05 significance level to test the researcher’s claim. (a) What is the appropriate hypothesis test to use for this analysis? Please identify and explain why it is appropriate. (b) Identify the null hypothesis and the alternative...
A social researcher wants to investigate the level of anxiety that people have based on the...
A social researcher wants to investigate the level of anxiety that people have based on the individual area of residence (urban vs. rural). The researcher uses alpha level of .05 to determine whether there is a significant difference in the level of anxiety between people who live in rural areas and people who live in urban areas. The data is presented in the table below. Rural Urban 14 13 8 7 n 15 15 a. State the null and alternative...
A survey found that out of 2613 adults, 1772 played on game consoles; while out of...
A survey found that out of 2613 adults, 1772 played on game consoles; while out of 1395 teens, 904 played on game consoles. Based on this survey, can you say there is a difference between adults and teens for playing on game consoles? Use alpha = 0.05. State the null and alternative hypotheses Calculate the test statistic Calculate the p-value or give a range of p-value, as appropriate. Draw the appropriate conclusion in the context of the problem. Calculate a...
a medical website states that 40% of U.S. adults are registered organ donors. A researcher believes...
a medical website states that 40% of U.S. adults are registered organ donors. A researcher believes that the proportion is too high and wants to test to see if it is lower. She selects a random sample 200 adults and finds that 74 of them are registered organ donors. Perform the hypothesis test at the 0.05 level. compute the p-value and state a conclusion.
Use the given information to find the p-value. Use a 0.05 significance level and state the...
Use the given information to find the p-value. Use a 0.05 significance level and state the conclusion about the null hypothesis (reject the null hypothesis or fail to reject the null hypothesis). a. The test statistic in a right-tailed test is z = 1.00. b. The test statistic in a test with alternative hypothesis p 6= 5/7 is z = 2.05. c. The test statistic in a test with alternative hypothesis p < 2/3 in z = −0.45.
I. In a KRC Research poll, 1002 adults were asked if they felt vulnerable to identity...
 I. In a KRC Research poll, 1002 adults were asked if they felt vulnerable to identity theft, and 531 of them said "yes". Use a 0.05 significance level to test the claim that the majority of adults feel vulnerable to identity theft. Write the null and alternative hypotheses in symbolic form. a. b. Find the test statistic. c. Find the P-value. d. Make a decision about the null hypothesis. e. State the final conclusion, addressing the original claim, in nontechnical...
1) Suppose a person claims that the proportion of all adults living in San Bernardino County...
 1) Suppose a person claims that the proportion of all adults living in San Bernardino County that are left-handed is less than 20%. A researcher decides to test this claim. Fill in the blanks and indicate which hypothesis is the claim in this case a) The null hypothesis Ho is: b) The alternative hypothesis H, is: c) Is this a two-tailed, right-tailed, or left-tailed test? The researcher decides to use a significance level of 0.05 for this test. Now suppose...
In a recent? poll, 789 adults were asked to identify their favorite seat when they? fly,...
In a recent? poll, 789 adults were asked to identify their favorite seat when they? fly, and 508 of them chose a window seat. Use a 0.05 significance level to test the claim that the majority of adults prefer window seats when they fly. Identify the null? hypothesis, alternative? hypothesis, test? statistic, P-value, conclusion about the null?hypothesis, and final conclusion that addresses the original claim. Use the? P-value method and the normal distribution as an approximation to the binomial distribution....
Question 5 An carlier study claimed that U.S adults spent an average of 114 minutes per...
 Question 5 An carlier study claimed that U.S adults spent an average of 114 minutes per day with their family. A recently raken sample of 25 adults from a city show'eod that they spend an average of 109 minutes per day with their family, Ihe population deviation is I1 minutes. Assume that the times spent by adults with their families have an approximate normal distribution Using a 1% significance level test whether the mean time spent currently by all adults...
 18. A researcher claims that more than 75% of the adults believe in global warming, Mimi conducted a survey on a random sample of 300 adults. The survey showed that 240 adults in the sample believe in global warming. Assume Mimi wants to use a 0.05 significance level to test the researcher's claim. (a) What is the appropriate hypothesis test to use for this analysis? Please identify and explain (b) Identify the null hypothesis and the alternative hypothesis. why it...
 I. In a KRC Research poll, 1002 adults were asked if they felt vulnerable to identity theft, and 531 of them said "yes". Use a 0.05 significance level to test the claim that the majority of adults feel vulnerable to identity theft. Write the null and alternative hypotheses in symbolic form. a. b. Find the test statistic. c. Find the P-value. d. Make a decision about the null hypothesis. e. State the final conclusion, addressing the original claim, in nontechnical...
 1) Suppose a person claims that the proportion of all adults living in San Bernardino County that are left-handed is less than 20%. A researcher decides to test this claim. Fill in the blanks and indicate which hypothesis is the claim in this case a) The null hypothesis Ho is: b) The alternative hypothesis H, is: c) Is this a two-tailed, right-tailed, or left-tailed test? The researcher decides to use a significance level of 0.05 for this test. Now suppose...
 Question 5 An carlier study claimed that U.S adults spent an average of 114 minutes per day with their family. A recently raken sample of 25 adults from a city show'eod that they spend an average of 109 minutes per day with their family, Ihe population deviation is I1 minutes. Assume that the times spent by adults with their families have an approximate normal distribution Using a 1% significance level test whether the mean time spent currently by all adults...
Most questions answered within 3 hours.
-
Write a program to solve the Josephus problem, with the following
modification:
Sample Input:
./a.out n...
asked 1 hour ago -
At the start of a CD it is spinning at a rate of 525 rpm
(revolutions...
asked 1 hour ago -
4. Without doing any calculations, predict whether the observed
∆T would increase, decrease or remain the...
asked 2 hours ago -
Based on the range, which of the following sets of scores has
the greatest variability? 3,...
asked 4 hours ago -
Ripples in a pond travel at a velocity of 3 m/s with one peak
passing a...
asked 3 hours ago -
A man stands on the roof of a building of height 13.0 mm and
throws a...
asked 3 hours ago -
The extent to which assets are financed by borrowed funds and
other liabilities is indicated by:...
asked 4 hours ago -
Explain in detail
Germany is the fifth largest economy
explain what goods and services Germany specializes...
asked 5 hours ago -
The density of platinum is 21.45 g/mL. If a cube of platinum
with a mass of...
asked 5 hours ago -
Accounts Receivable
Sales
A/R Posting
Extended Sales Invoice
Packing Slip
Compare invoice to packing slip 2...
asked 5 hours ago -
Michaella, age 23, is a full-time law student and is claimed by
her parents as a...
asked 5 hours ago -
Why are polymers not typically casted into products?
asked 5 hours ago