The graph illustrates the distribution of test scores taken by College Algebra students. The maximum possible...
The graph illustrates the distribution of test scores taken by
College Algebra students. The maximum possible score on the test
was 120, while the mean score was 79 and the standard deviation was
8.
55,63,71,79,87,95,103
Distribution of Test Scores
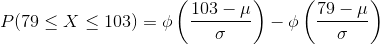
What is the approximate percentage of students who scored between
79 and 103 on the test?
%
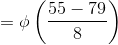
What is the approximate percentage of students who scored lower
than 55 on the test?
%
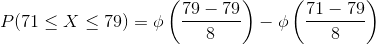
What is the approximate percentage of students who scored between
71 and 79?
%
What is the approximate percentage of students who scored between
63 and 95 on the test?
%
Homework Answers
Answer:

(a)


(b)


(c)

![=1-0.5-[1-0841]](http://img.homeworklib.com/questions/e78939f0-ec4d-11ea-827b-dbcbf97c2e17.png?x-oss-process=image/resize,w_560)

(d)


![=1-0.0227-[1-0.9772]](http://img.homeworklib.com/questions/e8d7b210-ec4d-11ea-bafe-1b1ab4f06a21.png?x-oss-process=image/resize,w_560)

Add Answer to:
The graph illustrates the distribution of test scores taken by
College Algebra students. The maximum possible...
The graph illustrates the distribution of test scores taken by College Algebra students. The maximum possible...
 The graph illustrates the distribution of test scores taken by
College Algebra students. The maximum possible score on the test
was 140, while the mean score was 71 and the standard deviation was
15.
1. What is the approximate percentage of students who scored
higher than 101 on the test?
2. What is the approximate percentage of students who scored
between 41 and 101 on the test?
3. What is the approximate percentage of students who scored
lower than 26...
The graph illustrates the distribution of test scores taken by
College Algebra students. The maximum possible score on the test
was 140, while the mean score was 71 and the standard deviation was
15.
1. What is the approximate percentage of students who scored
higher than 101 on the test?
2. What is the approximate percentage of students who scored
between 41 and 101 on the test?
3. What is the approximate percentage of students who scored
lower than 26...
The graph illustrates the distribution of test scores taken by College Algebra students. The maximum possible...
 The graph illustrates the distribution of test scores taken by
College Algebra students. The maximum possible score on the test
was 130, while the mean score was 77 and the standard deviation was
13. 38 51 64 77 90 103 116 Distribution of Test Scores What is the
approximate percentage of students who scored higher than 103 on
the test? % What is the approximate percentage of students who
scored between 64 and 77? % What is the approximate percentage...
The graph illustrates the distribution of test scores taken by
College Algebra students. The maximum possible score on the test
was 130, while the mean score was 77 and the standard deviation was
13. 38 51 64 77 90 103 116 Distribution of Test Scores What is the
approximate percentage of students who scored higher than 103 on
the test? % What is the approximate percentage of students who
scored between 64 and 77? % What is the approximate percentage...
The graph illustrates the distribution of test scores taken by College Algebra students. The maximum possible...
 The graph illustrates the distribution of test scores taken by College Algebra students. The maximum possible score on the test was 140, while the mean score was 79 and the standard deviation was 15. 34 49 64 79 94 109 124 Distribution of Test Scores What is the approximate percentage students who scored between 64 and 94 on the test? What is the approximate percentage of students who scored lower than 34 on the test? What is the approximate percentage...
The graph illustrates the distribution of test scores taken by College Algebra students. The maximum possible...
 The graph illustrates the distribution of test scores taken by College Algebra students. The maximum possible score on the test was 140, while the mean score was 75 and the standard deviation was 15. 30 45 105 120 60 75 90 Distribution of Test Scores Using the Empirical Rule, What is the approximate percentage of students who scored between 45 and 105 on the test? % What is the approximate percentage of students who scored higher than 105 on the...
he graph illustrates the distribution of test scores taken by College Algebra students. The maximum possil...
 he graph illustrates the distribution of test scores taken by College Algebra students. The maximum possil he test was 140, while the mean score was 74 and the standard deviation was 15. 29 44 104 119 59 74 89 Distribution of Test Scores Q What is the approximate percentage of students who scored between 29 and 74 on the test? % What is the approximate percentage of students who scored higher than 119 on the test? 1% What is the...
Enter a number rounded to one decimal if necessary. The scores of this test are normally...
 Enter a number rounded to one decimal if necessary. The scores of this test are normally distributed with a mean of 79 and a variance of 25. Then AJ percent of the students scored 74 or lower, percent of the students scored between 74 and 84, and percent of the students scored 79 or higher. Hide hint for Question 2 Draw a graph and use the 68-95-99.7 distribution percentages.
This year the test scores of all students in a college algebra course is normally distributed...
This year the test scores of all students in a college algebra course is normally distributed with a mean of 75 and a standard deviation of 10. Only the best 5% of the students will receive an A. What is the minimum score a student must obtain to get an A?
3. Exam scores on a certain test are distributed normally, with a mean of 72 and...
 3. Exam scores on a certain test are distributed normally, with a mean of 72 and a standard devi- ation of 12. (a) Find the 95th percentile for the exam. (b) Suppose a student who took the exam is selected at random. Find the probability that the student scored between 71 and 73. Draw a graph that illustrates the probability calculated. (C) If you take a simple random sample of 36 students who have taken this exam, what is the...
On a nationwide test taken by high school students, the mean score was 51 and the...
On a nationwide test taken by high school students, the mean score was 51 and the standard deviation was 11 The scores were normally distributed. Complete the following statements. (a) Approximately ?% of the students scored between 40 and 62 . (b) Approximately 95% of the students scored between ? and ?
Use the Grouped Distribution method for the following exercise (see Self-Test 2-4 for detailed instructions), rounding...
Use the Grouped Distribution method for the following exercise (see Self-Test 2-4 for detailed instructions), rounding each answer to the nearest whole number. Using the frequency distribution below (scores on a statistics exam taken by 80 students), determine:ion 1 of the preliminary test (scores on a statistics exam taken by 80 students), determine: 68 84 75 82 68 90 62 88 76 93 73 79 88 73 60 93 71 59 85 75 61 65 75 87 74 62 95...
 The graph illustrates the distribution of test scores taken by
College Algebra students. The maximum possible score on the test
was 140, while the mean score was 71 and the standard deviation was
15.
1. What is the approximate percentage of students who scored
higher than 101 on the test?
2. What is the approximate percentage of students who scored
between 41 and 101 on the test?
3. What is the approximate percentage of students who scored
lower than 26...
The graph illustrates the distribution of test scores taken by
College Algebra students. The maximum possible score on the test
was 140, while the mean score was 71 and the standard deviation was
15.
1. What is the approximate percentage of students who scored
higher than 101 on the test?
2. What is the approximate percentage of students who scored
between 41 and 101 on the test?
3. What is the approximate percentage of students who scored
lower than 26...
 The graph illustrates the distribution of test scores taken by
College Algebra students. The maximum possible score on the test
was 130, while the mean score was 77 and the standard deviation was
13. 38 51 64 77 90 103 116 Distribution of Test Scores What is the
approximate percentage of students who scored higher than 103 on
the test? % What is the approximate percentage of students who
scored between 64 and 77? % What is the approximate percentage...
The graph illustrates the distribution of test scores taken by
College Algebra students. The maximum possible score on the test
was 130, while the mean score was 77 and the standard deviation was
13. 38 51 64 77 90 103 116 Distribution of Test Scores What is the
approximate percentage of students who scored higher than 103 on
the test? % What is the approximate percentage of students who
scored between 64 and 77? % What is the approximate percentage...
 The graph illustrates the distribution of test scores taken by College Algebra students. The maximum possible score on the test was 140, while the mean score was 79 and the standard deviation was 15. 34 49 64 79 94 109 124 Distribution of Test Scores What is the approximate percentage students who scored between 64 and 94 on the test? What is the approximate percentage of students who scored lower than 34 on the test? What is the approximate percentage...
 The graph illustrates the distribution of test scores taken by College Algebra students. The maximum possible score on the test was 140, while the mean score was 75 and the standard deviation was 15. 30 45 105 120 60 75 90 Distribution of Test Scores Using the Empirical Rule, What is the approximate percentage of students who scored between 45 and 105 on the test? % What is the approximate percentage of students who scored higher than 105 on the...
 he graph illustrates the distribution of test scores taken by College Algebra students. The maximum possil he test was 140, while the mean score was 74 and the standard deviation was 15. 29 44 104 119 59 74 89 Distribution of Test Scores Q What is the approximate percentage of students who scored between 29 and 74 on the test? % What is the approximate percentage of students who scored higher than 119 on the test? 1% What is the...
 Enter a number rounded to one decimal if necessary. The scores of this test are normally distributed with a mean of 79 and a variance of 25. Then AJ percent of the students scored 74 or lower, percent of the students scored between 74 and 84, and percent of the students scored 79 or higher. Hide hint for Question 2 Draw a graph and use the 68-95-99.7 distribution percentages.
 3. Exam scores on a certain test are distributed normally, with a mean of 72 and a standard devi- ation of 12. (a) Find the 95th percentile for the exam. (b) Suppose a student who took the exam is selected at random. Find the probability that the student scored between 71 and 73. Draw a graph that illustrates the probability calculated. (C) If you take a simple random sample of 36 students who have taken this exam, what is the...
Most questions answered within 3 hours.
-
D. A student completed 20 courses in the School of Arts and
Sciences. Her grades in...
asked 1 hour ago -
teo
pucks moving on a frictionless air table are about to collide. the
1.5 kg puck...
asked 1 hour ago -
Problem #1
The area between Z = 0 and Z = 2.50
The area between Z...
asked 2 hours ago -
1. What is the meaning of the term communication style?
2. What are the benefits to...
asked 2 hours ago -
9.) You are buying a car that cost $26,500. You make payments of
$412 each month...
asked 2 hours ago -
. Suppose a discrete random variable has probability
distribution
P(x) = .2 if x = 0...
asked 3 hours ago -
Under the influence of its drive force, a snowmobile is moving
at a constant velocity along...
asked 4 hours ago -
Why do organizations decline? What steps can top
management take to halt, decline, and restore organizational...
asked 4 hours ago -
What mechanisms Drive speciation??
(I.e. what was Dawins theory on the orgin of species, and how...
asked 5 hours ago -
The manager at a car assembly plant believes that the mean
assembly time for a car...
asked 6 hours ago -
Which of the following is true of electron capture?
A) It decreases the nuclide's mass number...
asked 8 hours ago -
Assuming an efficiency of 43.10%, calculate the actual yield of
magnesium nitrate formed from 114.9 g...
asked 8 hours ago