

Homework Answers
1) Yes
-----------
Selecting a worker who is reducing the amount of vacation
-----------
A. n = 30
-----------
A. p = 0.52
-----------
A. q = 0.48
------------------------------------------------------
2)
Add Answer to:
A survey asks 2000 workers. Has the economy forced you to reduce the amount of vacation...
A survey aska 2000 workers as the economy forced you to reduce the amount of vacation...
 A survey aska 2000 workers as the economy forced you to reduce the amount of vacation you plan to this year Fifty-seven percent of the surveyed say they wereducing the amount of vacation. Twenty wores participating in the survey are randomly selected. The random variable represents the number of workers who are reducing the amount of vacation. Decide whether the experiment binomi permet de succes, specify the values of Panda and list the possible values of the random variable. is...
Is achieving a basic skill level related to the location of the school? The results of...
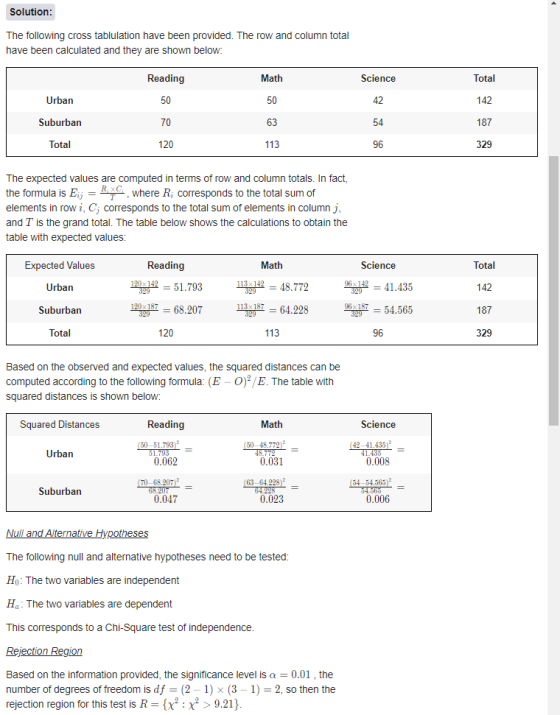
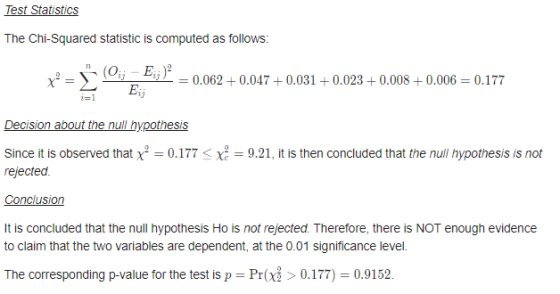
 Is achieving a basic skill level related to the location of the school? The results of a random sample of students by the location of Subject school and the number of students achieving basic skill levels in three subjects is shown in the contingency table. At a = 0.05, test Location Reading Math Science the hypothesis that the variables are independent. Complete parts (a) through (d). Urban 49 42 43 Suburban 69 64 62 (a) Identify the claim and state...
39 2. is achieving a basic skill level related to the location of the Subject school?...
 39 2. is achieving a basic skill level related to the location of the Subject school? The results of a random sample of students by the Location Reading Math Science location of school and the number of students achieving Urban 45 49 basic skill levels in three subjects is shown in the Suburban 69 contingency table. At a = 0.05, test the hypothesis that the variables are independent. Complete parts (a) through (d). (a) Identify the claim and state the...
A magazine claims that the mean amount spent by a customer at Burger Stop is greater...
 A magazine claims that the mean amount spent by a customer at Burger Stop is greater than the mean amount spent by a customer at Fry World. The results for samples of customer transactions for the two fast food restaurants are shown below. At a 0.10, can you upport the magazine's claim? Assume the population variances are equal. Assume the samples are random and independent, and the populations are nomaly distributed Complete parts (a) through (e) below. Burger Stop Fry...
#3 A group conducted a randomized experiment to see if hormone therapy was helpful for post-menopausal...
 #3
A group conducted a randomized experiment to see if hormone therapy was helpful for post-menopausal women The women were randomly assigned to receive a hormone or a placebo After 5 years, 119 of the 8589 on the hormone therapy developed cancer and 83 of the 8437 in the placebo group developed cancerIs this a significant difference? Complete parts a through c below a. State the assumptions and the hypotheses What assumptions about the two samples are necessary to be...
#3
A group conducted a randomized experiment to see if hormone therapy was helpful for post-menopausal women The women were randomly assigned to receive a hormone or a placebo After 5 years, 119 of the 8589 on the hormone therapy developed cancer and 83 of the 8437 in the placebo group developed cancerIs this a significant difference? Complete parts a through c below a. State the assumptions and the hypotheses What assumptions about the two samples are necessary to be...
Course In a survey of 172 females who recently completed high school, 75% were enrolled in...
 Course In a survey of 172 females who recently completed high school, 75% were enrolled in college. In a survey of 160 males who recently completed high school, 65% were enrolled in college. At = 0.09, can you reject the claim that there is no difference in the proportion of college enrollees between the two groups? Assume the random samples are independent. Complete parts (a) through (e). Syllabus Class Ha (a) Identity the claim and state Ho and H. adet...
In a survey of 180 females who recently completed high school, 75% were enrolled in college....
 In a survey of 180 females who recently completed high school, 75% were enrolled in college. In a survey of 160 males who recently completed high school, 65% were enrolled in college. At a = 0.06, can you reject the claim that there is no difference in the proportion of college enrollees between the two groups? Assume the random samples are independent. Complete parts (a) through (@). (a) Identify the claim and state Ho and H. The claim is "the...
b.) find the critical values and rejection regions c.) find the standardized test statistic, z d.)...
 b.) find the critical values and rejection regions
c.) find the standardized test statistic, z
d.) decide whether to reject or fail to reject
e.) interpret
In a survey af 1000 drivers from Region A, 855 wear a seat belt. In a survey of 1000 drivers from Region B, 909 wear a seat bet. At a0.10, is there evidence to support the claim that the proportion of drivers who wear seat belts in Region A is less than the proportion...
b.) find the critical values and rejection regions
c.) find the standardized test statistic, z
d.) decide whether to reject or fail to reject
e.) interpret
In a survey af 1000 drivers from Region A, 855 wear a seat belt. In a survey of 1000 drivers from Region B, 909 wear a seat bet. At a0.10, is there evidence to support the claim that the proportion of drivers who wear seat belts in Region A is less than the proportion...
In a 4-week study about the effectiveness of using magnetic insoles to treat plantar heel pain,...
 In a 4-week study about the effectiveness of using magnetic insoles to treat plantar heel pain, 52 subjects wore magnetic insoles and 41 subjects wore nonmagnetic insoles. The results are shown at the right. At a =0.06, can you support the claim that there is a difference in the proportion of subjects who feel better between the two groups? Assume the random samples are independent. Complete parts (a) through (e). Do you Feel Better? Magnetic Insoles Yes 14 No 38...
In a survey of 1000 drivers from Region A, 849 wear a seat belt. In a...
 In a survey of 1000 drivers from Region A, 849 wear a seat belt. In a survey of 1000 drivers from Region B, 906 wear a seat belt. At a = 0.01, is there evidence to support the claim that the proportion of drivers who wear seat belts in Region A is less than the proportion of drivers who wear seat belts in Region B? Assume that the samples are random and independent. Complete parts (a) through (e) below. (a)...
 A survey aska 2000 workers as the economy forced you to reduce the amount of vacation you plan to this year Fifty-seven percent of the surveyed say they wereducing the amount of vacation. Twenty wores participating in the survey are randomly selected. The random variable represents the number of workers who are reducing the amount of vacation. Decide whether the experiment binomi permet de succes, specify the values of Panda and list the possible values of the random variable. is...
 Is achieving a basic skill level related to the location of the school? The results of a random sample of students by the location of Subject school and the number of students achieving basic skill levels in three subjects is shown in the contingency table. At a = 0.05, test Location Reading Math Science the hypothesis that the variables are independent. Complete parts (a) through (d). Urban 49 42 43 Suburban 69 64 62 (a) Identify the claim and state...
 39 2. is achieving a basic skill level related to the location of the Subject school? The results of a random sample of students by the Location Reading Math Science location of school and the number of students achieving Urban 45 49 basic skill levels in three subjects is shown in the Suburban 69 contingency table. At a = 0.05, test the hypothesis that the variables are independent. Complete parts (a) through (d). (a) Identify the claim and state the...
 A magazine claims that the mean amount spent by a customer at Burger Stop is greater than the mean amount spent by a customer at Fry World. The results for samples of customer transactions for the two fast food restaurants are shown below. At a 0.10, can you upport the magazine's claim? Assume the population variances are equal. Assume the samples are random and independent, and the populations are nomaly distributed Complete parts (a) through (e) below. Burger Stop Fry...
 #3
A group conducted a randomized experiment to see if hormone therapy was helpful for post-menopausal women The women were randomly assigned to receive a hormone or a placebo After 5 years, 119 of the 8589 on the hormone therapy developed cancer and 83 of the 8437 in the placebo group developed cancerIs this a significant difference? Complete parts a through c below a. State the assumptions and the hypotheses What assumptions about the two samples are necessary to be...
#3
A group conducted a randomized experiment to see if hormone therapy was helpful for post-menopausal women The women were randomly assigned to receive a hormone or a placebo After 5 years, 119 of the 8589 on the hormone therapy developed cancer and 83 of the 8437 in the placebo group developed cancerIs this a significant difference? Complete parts a through c below a. State the assumptions and the hypotheses What assumptions about the two samples are necessary to be...
 Course In a survey of 172 females who recently completed high school, 75% were enrolled in college. In a survey of 160 males who recently completed high school, 65% were enrolled in college. At = 0.09, can you reject the claim that there is no difference in the proportion of college enrollees between the two groups? Assume the random samples are independent. Complete parts (a) through (e). Syllabus Class Ha (a) Identity the claim and state Ho and H. adet...
 In a survey of 180 females who recently completed high school, 75% were enrolled in college. In a survey of 160 males who recently completed high school, 65% were enrolled in college. At a = 0.06, can you reject the claim that there is no difference in the proportion of college enrollees between the two groups? Assume the random samples are independent. Complete parts (a) through (@). (a) Identify the claim and state Ho and H. The claim is "the...
 b.) find the critical values and rejection regions
c.) find the standardized test statistic, z
d.) decide whether to reject or fail to reject
e.) interpret
In a survey af 1000 drivers from Region A, 855 wear a seat belt. In a survey of 1000 drivers from Region B, 909 wear a seat bet. At a0.10, is there evidence to support the claim that the proportion of drivers who wear seat belts in Region A is less than the proportion...
b.) find the critical values and rejection regions
c.) find the standardized test statistic, z
d.) decide whether to reject or fail to reject
e.) interpret
In a survey af 1000 drivers from Region A, 855 wear a seat belt. In a survey of 1000 drivers from Region B, 909 wear a seat bet. At a0.10, is there evidence to support the claim that the proportion of drivers who wear seat belts in Region A is less than the proportion...
 In a 4-week study about the effectiveness of using magnetic insoles to treat plantar heel pain, 52 subjects wore magnetic insoles and 41 subjects wore nonmagnetic insoles. The results are shown at the right. At a =0.06, can you support the claim that there is a difference in the proportion of subjects who feel better between the two groups? Assume the random samples are independent. Complete parts (a) through (e). Do you Feel Better? Magnetic Insoles Yes 14 No 38...
 In a survey of 1000 drivers from Region A, 849 wear a seat belt. In a survey of 1000 drivers from Region B, 906 wear a seat belt. At a = 0.01, is there evidence to support the claim that the proportion of drivers who wear seat belts in Region A is less than the proportion of drivers who wear seat belts in Region B? Assume that the samples are random and independent. Complete parts (a) through (e) below. (a)...
Most questions answered within 3 hours.
-
1(a). Draw both chair conformations of
trans-1-chloro-2-methylcyclohexane. Compare stabilities. (b) .Draw
both chair conformations of cis-1-...
asked 1 minute ago -
Which of the following is true regarding stakeholders?
A. The term stakeholder is a variant of...
asked 15 seconds ago -
Graph the mean winning margins for years 2005 - 2007 for women's
NCAA Basketball tournaments. Is...
asked 10 minutes ago -
The equilibrium constant, K, of a certain first order reaction
was measured at two temperatures, T....
asked 9 minutes ago -
Management by walking around (MBWA) refers to
a. the process used by new executives to get...
asked 22 minutes ago -
consider the molecule H2CO using valence bond theory describe
the location of the carbon electrons. the...
asked 24 minutes ago -
Apply the simple GCD algorithm for:
1. a = 112, y = 32
2. a =...
asked 22 minutes ago -
A test of hypotheses for one proportion has the following Null
Hypothesis: pi = 0.33, and...
asked 26 minutes ago -
In regression analysis: a. the independent variable must be
categorical in nature. b. the variables being...
asked 54 minutes ago -
You want to rent an unfurnished one-bedroom apartment in Boston
next year. The mean monthly rent...
asked 54 minutes ago -
How many moles of carbon dioxide gas will occupy a volume of
6.25 L at 4.2atm...
asked 49 minutes ago -
What is the speed of sound, in FT/S, if the air temperature
is,
A: 0.0C
B:...
asked 34 minutes ago