
Homework Answers
![Ho: P,=P2 Hi :P, < Pa (one failed test) Sample X, -855, n. = 1000 Sample a ng = 1000, Xa=909 Po - 92 - 60-909 310-955] 855 +](http://img.homeworklib.com/questions/37b20350-78dc-11ea-9245-a58cf6496c68.png?x-oss-process=image/resize,w_560)
![Test stadistic Z = pP46-9)+(:24) 0.855 -0.909 0-382 x (1-0-882)x (tore taboo) = -3.74498 7--3,74 [7 =-3-54] Since, test Stali](http://img.homeworklib.com/questions/3833b740-78dc-11ea-9230-677e5934f502.png?x-oss-process=image/resize,w_560)
Add Answer to:
b.) find the critical values and rejection regions
c.) find the standardized test statistic, z
d.)...
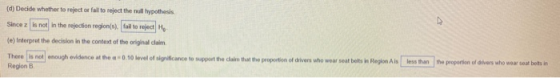
In a survey of 1000 drivers from Region A, 878 wear a seat belt. In a...
 In a survey of 1000 drivers from Region A, 878 wear a seat belt. In a survey of 1000 drivers from Region B. 923 wear a seat belt At a 001, is there evidence to support the dlaim that the proportion of drivers who wear seat belts in Region A is less than the proportion of drivers who wear seat belts in Region 8? Assume that the samples are random and independent Complete parts (a) through (e) below Identily the...
In a survey of 1000 drivers from Region A, 849 wear a seat belt. In a...
 In a survey of 1000 drivers from Region A, 849 wear a seat belt. In a survey of 1000 drivers from Region B, 906 wear a seat belt. At a = 0.01, is there evidence to support the claim that the proportion of drivers who wear seat belts in Region A is less than the proportion of drivers who wear seat belts in Region B? Assume that the samples are random and independent. Complete parts (a) through (e) below. (a)...
Find the critical value(s) and rejection region(s) for the type of z-test with level of significance...
 Find the critical value(s) and rejection region(s) for the type of z-test with level of significance a. Include a graph with your answer. Two-tailed test, α = 0.04 The critical value(s) is/are z Round to two decimal places as needed. Use a comma to separate answers as needed.) Select the correct choice below and, if necessary, fill in the answer box to complete your choice. Round to two decimal places as needed.) A. The rejection regions are z< and z>...
Question Hele ha survey of 1000 drivers from Region A 876 war a seat belt in...
 Question Hele ha survey of 1000 drivers from Region A 876 war a seat belt in a way of drivers from Region 3,923 war abelt 001, is there evidence to suport the came that the proportion des who wear seat belts in Region A is loss than the proportion of who were botsin Rajon? Asume that the samples are random and independent. Complete ports through below Ventily the daim Lal population 1 bedies from Region and let population be drivers...
For the given data, (a) find the test statistic, (b) find the standardized test statistic, (c)...
 For the given data, (a) find the test statistic, (b) find the standardized test statistic, (c) decide whether the standardized test statistic is in the rejection region, and (d) decide whether you should reject or fail to reject the null hypothesis. The samples are random and independent , a = 0.01. Sample statistics: x = 1235, n 40, x2 = 1195, and n2 = 70. Population statistics: o1 65 and a2 120. Claim: (a) The test statistic for -H2is (b)...
a.) what is the claim? identify H0 and Ha b.) find the critical values and rejection...
 a.) what is the claim? identify H0 and Ha
b.) find the critical values and rejection region
c.) find the standarized test statistic z
An energy company wants to choose between two regions in a state to install new producing wind turbines Aresearcher claims that the wind speed in Region Ais less than the wind speed in Region B. To test the regions, the average wind speed is calculated for 60 days in each region. The mean wind speed in...
a.) what is the claim? identify H0 and Ha
b.) find the critical values and rejection region
c.) find the standarized test statistic z
An energy company wants to choose between two regions in a state to install new producing wind turbines Aresearcher claims that the wind speed in Region Ais less than the wind speed in Region B. To test the regions, the average wind speed is calculated for 60 days in each region. The mean wind speed in...
For the given data, (a) find the test statistic, (b) find the standardized test statistic, (c)...
 For the given data, (a) find the test statistic, (b) find the standardized test statistic, (c) decide whether the standardized test statistic is in the rejection region, and (d) decide whether you should reject or fail to reject the null hypothesis. The samples are random and independent Claim: <H2, a=0.01. Sample statistics: x = 1235, n = 30, X2 = 1205, and n = 60. Population statistics: 6 = 70 and 62 = 100. (a) The test statistic for ,...
A research center claims that at least 30% of adults in a certain country think that...
 A research center claims that at least 30% of adults in a certain country think that their taxes will be audited. In a random sample of 700 adults in that country in a recent year, 20% say they are concerned that their taxes will be audited. At α=0.10, is there enough evidence to reject the center's claim? Complete parts (a) through (e) below. (a) Identify the claim and state Ho and H ldentify the claim in this scenario. Select the...
A medical researcher says that less than 87% of adults in a certain country think that...
 A medical researcher says that less than 87% of adults in a certain country think that healthy children should be required to be vaccinated. In a random sample of 600 adults in that country, 85% think that healthy children should be required to be vaccinated. At α= 0.10, is there enough evidence to support the researchers claim? Complete parts (a) through (e) beloww. (a) Identify the claim and state Ho and H ldentify the claim in this scenario. Select the...
find the standardized test statistic z aslo, is part d correct? An energy company wants to...
 find the standardized test statistic z
aslo, is part d correct?
An energy company wants to choose between two regions in a state to install energy producing windturbines Aresearcher claims that the wind speed in Region A is less than the wind speed in Region B. To test the regions, the average wind speed is calculated for 90 days in each region. The mean wind speed in Region Als 138 miles per hour. Assume the population standard deviation is 2.8...
find the standardized test statistic z
aslo, is part d correct?
An energy company wants to choose between two regions in a state to install energy producing windturbines Aresearcher claims that the wind speed in Region A is less than the wind speed in Region B. To test the regions, the average wind speed is calculated for 90 days in each region. The mean wind speed in Region Als 138 miles per hour. Assume the population standard deviation is 2.8...
 In a survey of 1000 drivers from Region A, 878 wear a seat belt. In a survey of 1000 drivers from Region B. 923 wear a seat belt At a 001, is there evidence to support the dlaim that the proportion of drivers who wear seat belts in Region A is less than the proportion of drivers who wear seat belts in Region 8? Assume that the samples are random and independent Complete parts (a) through (e) below Identily the...
 In a survey of 1000 drivers from Region A, 849 wear a seat belt. In a survey of 1000 drivers from Region B, 906 wear a seat belt. At a = 0.01, is there evidence to support the claim that the proportion of drivers who wear seat belts in Region A is less than the proportion of drivers who wear seat belts in Region B? Assume that the samples are random and independent. Complete parts (a) through (e) below. (a)...
 Find the critical value(s) and rejection region(s) for the type of z-test with level of significance a. Include a graph with your answer. Two-tailed test, α = 0.04 The critical value(s) is/are z Round to two decimal places as needed. Use a comma to separate answers as needed.) Select the correct choice below and, if necessary, fill in the answer box to complete your choice. Round to two decimal places as needed.) A. The rejection regions are z< and z>...
 Question Hele ha survey of 1000 drivers from Region A 876 war a seat belt in a way of drivers from Region 3,923 war abelt 001, is there evidence to suport the came that the proportion des who wear seat belts in Region A is loss than the proportion of who were botsin Rajon? Asume that the samples are random and independent. Complete ports through below Ventily the daim Lal population 1 bedies from Region and let population be drivers...
 For the given data, (a) find the test statistic, (b) find the standardized test statistic, (c) decide whether the standardized test statistic is in the rejection region, and (d) decide whether you should reject or fail to reject the null hypothesis. The samples are random and independent , a = 0.01. Sample statistics: x = 1235, n 40, x2 = 1195, and n2 = 70. Population statistics: o1 65 and a2 120. Claim: (a) The test statistic for -H2is (b)...
 a.) what is the claim? identify H0 and Ha
b.) find the critical values and rejection region
c.) find the standarized test statistic z
An energy company wants to choose between two regions in a state to install new producing wind turbines Aresearcher claims that the wind speed in Region Ais less than the wind speed in Region B. To test the regions, the average wind speed is calculated for 60 days in each region. The mean wind speed in...
a.) what is the claim? identify H0 and Ha
b.) find the critical values and rejection region
c.) find the standarized test statistic z
An energy company wants to choose between two regions in a state to install new producing wind turbines Aresearcher claims that the wind speed in Region Ais less than the wind speed in Region B. To test the regions, the average wind speed is calculated for 60 days in each region. The mean wind speed in...
 For the given data, (a) find the test statistic, (b) find the standardized test statistic, (c) decide whether the standardized test statistic is in the rejection region, and (d) decide whether you should reject or fail to reject the null hypothesis. The samples are random and independent Claim: <H2, a=0.01. Sample statistics: x = 1235, n = 30, X2 = 1205, and n = 60. Population statistics: 6 = 70 and 62 = 100. (a) The test statistic for ,...
 A research center claims that at least 30% of adults in a certain country think that their taxes will be audited. In a random sample of 700 adults in that country in a recent year, 20% say they are concerned that their taxes will be audited. At α=0.10, is there enough evidence to reject the center's claim? Complete parts (a) through (e) below. (a) Identify the claim and state Ho and H ldentify the claim in this scenario. Select the...
 A medical researcher says that less than 87% of adults in a certain country think that healthy children should be required to be vaccinated. In a random sample of 600 adults in that country, 85% think that healthy children should be required to be vaccinated. At α= 0.10, is there enough evidence to support the researchers claim? Complete parts (a) through (e) beloww. (a) Identify the claim and state Ho and H ldentify the claim in this scenario. Select the...
 find the standardized test statistic z
aslo, is part d correct?
An energy company wants to choose between two regions in a state to install energy producing windturbines Aresearcher claims that the wind speed in Region A is less than the wind speed in Region B. To test the regions, the average wind speed is calculated for 90 days in each region. The mean wind speed in Region Als 138 miles per hour. Assume the population standard deviation is 2.8...
find the standardized test statistic z
aslo, is part d correct?
An energy company wants to choose between two regions in a state to install energy producing windturbines Aresearcher claims that the wind speed in Region A is less than the wind speed in Region B. To test the regions, the average wind speed is calculated for 90 days in each region. The mean wind speed in Region Als 138 miles per hour. Assume the population standard deviation is 2.8...
Most questions answered within 3 hours.
-
The condensate from a steam distillation contains 12.0 g of
compound A and 18.0 g of...
asked 1 hour ago -
A major economic benefit of fixed exchange rates compared to
floating rates is that
a. the...
asked 1 hour ago -
1) For this reaction,
SiCl4 (l)+ 2H2O(g) <->
SiO2 (s) + 4HCl (g) DeltaH = -127 KJ...
asked 1 hour ago -
Which of the following does NOT add to US GDP? A. Saudi Arabia
buys fighter jets...
asked 3 hours ago -
2. Describe market equilibrium in terms of the following
characteristics
d.
How supply and demand interactions...
asked 3 hours ago -
1a. Create a class named Computer
- Separate declaration from implementation (i.e. Header and CPP
files)...
asked 3 hours ago -
A medical researcher
believes that a drug changes the body's temperature. Seven test
subjects are randomly...
asked 3 hours ago -
A call option on Project Cash Flow Consulting Inc.'s stock (PCF)
has a market price of...
asked 3 hours ago -
A study on the latest fad diet claimed that the amounts of
weight lost by all...
asked 4 hours ago -
give examples of how gene expression is inherited to the next
generation?
asked 3 hours ago -
If a project has _________ IRR(s), we should __________ . Assume
this project is competing with...
asked 4 hours ago -
In the figure, a sound of wavelength 0.700 m is emitted
isotropically by point source S....
asked 4 hours ago