Scenario: 100 people were asked, “Who is your favorite superhero?” Below are the data. Test the...
Scenario: 100 people were asked, “Who is your favorite superhero?” Below are the data. Test the null hypothesis that the population frequencies for each category are equal. α= .05.
| Iron Man | Black Panther | Wonder Woman | Spiderman |
| fo = 20 | fo = 30 | fo =30 | fo = 20 |
| fe= | fe= | fe= | fe= |
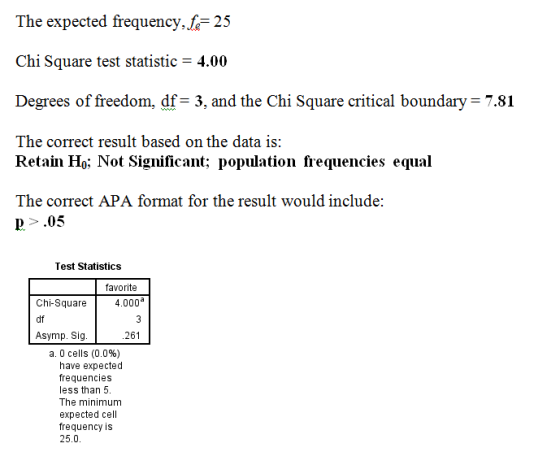
The expected frequency, fe= ____
4
25
20
100
Chi Square test statistic = ______
6.55
4.00
8.00
3.50
degrees of freedom, df = ______, and the Chi Square critical boundary = ______
1; 3.84
3; 7.81
2; 5.99
4; 9.49
What is the correct result based on the data?
Retain H0; Not Significant; population frequencies equal
Reject H0; Significant; population frequencies NOT equal
Reject H0; Significant; population frequencies equal
Retain H0; Not Significant; population frequencies NOT equal
The correct APA format for the result would include
p < .05
p > .05
Homework Answers
Add Answer to:
Scenario: 100 people were asked, “Who is your favorite
superhero?” Below are the data. Test the...
Scenario: 100 people were asked, "Who is your favorite superhero?" Below are the data. Test the...
 Scenario: 100 people were asked, "Who is your favorite superhero?" Below are the data. Test the null hypothesis that the population frequencies for each category are equal. a=.05. Iron Man Black Panther Wonder Woman Spiderman f. = 20 f. = 30 f. =30 fo = 20 fe fe fe = The expected frequency, fe = O 20 4 O O 100 25 [example continued...] Scenario: 100 people were asked, "Who is your favorite superhero?" Below are the data. Test the...
Scenario: I'm interested in whether there is a relationship between Team (A vs. B) and Outcome...
Scenario: I'm interested in whether there is a relationship between Team (A vs. B) and Outcome (Good vs. Bad). Below are the data. Test the null hypothesis that the categories are independent. α= .05. Team A Team B Good Outcome fo = 35 fe= fo = 55 fe= Bad Outcome fo = 15 fe= fo = 45 fe= The expected frequency, fe , for the Team A X Good Outcome category = _____ 20 90 30 40 The Chi Square...
5. Interpretation of a chi-square test for goodness of fit Suppose you are reading a study...
 5. Interpretation of a chi-square test for goodness of fit Suppose you are reading a study conducted in the year 2000 about welfare recipients in the United States. The study consisted of a random sample of 199 welfare recipients, and provides summary statistics about various demographic characteristics of the sample, indluding household size broken down into five categories (one, two, three, four, and five or more persons in the household). You wonder if welfare recipients tend to live in different-...
Using the accompanying data below, perform a chi-square test using alphaαequals=0.01 to determine if the proportion...
Using the accompanying data below, perform a chi-square test using alphaαequals=0.01 to determine if the proportion of "Yes" observations differs between Populations A and B. Observed frequencies: Population Yes No A 18 20 B 22 20 Expected frequencies: Population Yes No A 19 19 B 21 21 Click the icon to view an excerpt from the table of chi-square critical values. What are the null and alternative hypotheses? A. Upper H 0H0: p Subscript Upper A Baseline not equals p...
A distribution and the observed frequencies of the values of a variable from a simple random sample of the population are provided below. Use the chi-square goodness-of-fit test to decide, at the spe...
 A distribution and the observed frequencies of the values of a variable from a simple random sample of the population are provided below. Use the chi-square goodness-of-fit test to decide, at the specified significance level, whether the distribution of the variable differs from the given distribution Distribution: 0.1875, 0.1875, Observed frequencies: 16, 20, 24, 36 Significance level 0.05 0.3125, 0.3125 Determine the null and alternative hypotheses. Choose the correct answer below. OA. H: The distribution of the variable differs from...
 Scenario: 100 people were asked, "Who is your favorite superhero?" Below are the data. Test the null hypothesis that the population frequencies for each category are equal. a=.05. Iron Man Black Panther Wonder Woman Spiderman f. = 20 f. = 30 f. =30 fo = 20 fe fe fe = The expected frequency, fe = O 20 4 O O 100 25 [example continued...] Scenario: 100 people were asked, "Who is your favorite superhero?" Below are the data. Test the...
 5. Interpretation of a chi-square test for goodness of fit Suppose you are reading a study conducted in the year 2000 about welfare recipients in the United States. The study consisted of a random sample of 199 welfare recipients, and provides summary statistics about various demographic characteristics of the sample, indluding household size broken down into five categories (one, two, three, four, and five or more persons in the household). You wonder if welfare recipients tend to live in different-...
 A distribution and the observed frequencies of the values of a variable from a simple random sample of the population are provided below. Use the chi-square goodness-of-fit test to decide, at the specified significance level, whether the distribution of the variable differs from the given distribution Distribution: 0.1875, 0.1875, Observed frequencies: 16, 20, 24, 36 Significance level 0.05 0.3125, 0.3125 Determine the null and alternative hypotheses. Choose the correct answer below. OA. H: The distribution of the variable differs from...
Most questions answered within 3 hours.
-
An entomologist discovers a dung beetle rolling a ball of dung
along the ground, and decides...
asked 45 minutes ago -
Humans have used horses for transportation for millions of
years. Therefore, they will use horses for...
asked 2 hours ago -
The following are the Jensen Corporation's unit costs of making
and selling an item at a...
asked 3 hours ago -
Does direct Medicare reimbursement of Advanced practice nurses
increase access to their services?
asked 4 hours ago -
List and explain why a company would choose to use a
published
compensation survey vs. creating...
asked 4 hours ago -
A discrete random variable X can take values from 1 to 10. Find
the variance of...
asked 4 hours ago -
The primary financial goal of a corporation is to maximize:
shareholders wealth.
earnings per share.
stock...
asked 4 hours ago -
determine whether the vectors u=(1,2,3,), v=(-2,1,0) and
w=(1,0,1) are linearly dependent or independent.
asked 4 hours ago -
python
Define a function called print_values which takes a dictionary
object as a parameter. The function...
asked 5 hours ago -
In Chapter 1 you created a program named Triangle in
which you displayed a seven-line triangle...
asked 5 hours ago -
Research question: What are the differences between separately
stated and non separately stated transactions in an...
asked 5 hours ago -
By using Arduino write a code that connects two LEDs to two
push-buttons. Each button controls...
asked 6 hours ago