
Homework Answers
Answer #1
The statistical software output for this problem is :
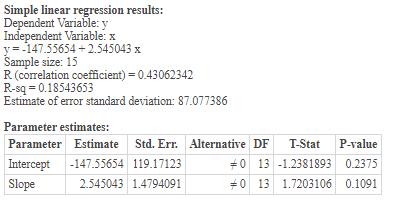
r = 0.431
r 2 = 18.5%
Simple linear regression results: Dependent Variable: y Independent Variable: x y=-147.55654 +2.545043 x Sample size: 15 R (correlation coefficient) = 0.43062342 R-sq-0.18543653 Estimate of error standard deviation: 87.077386 Parameter estimates: Parameter Estimate Std. Err. Alternative DF T-Stat P-value Intercept -147.55654 119.17123 +0 13 -1.2381893 0.2375 Slope 2.545043 1.4794091 +0 13 1.7203106 0.1091
Know the answer?
Add Answer to:
Here is a bivariate data set. х у 91.1 82.3 94.3 43.6 72.7 6.3 89.5 -19.9...
Not the answer you're looking for?
Ask your own homework help question.
Our experts will answer your question WITHIN MINUTES for Free.
Similar Homework Help Questions
Steps Open the Heart Rate Dataset in Excel Using the classification of variables from Unit 1 assignment as qualitativ...
Steps Open the Heart Rate Dataset in Excel Using the classification of variables from Unit 1 assignment as qualitative, quantitative discrete, or quantitative continuous, match each of the 3 variables to the most appropriate graph type. (For example, qualitative data can best be displayed with a pie chart or bar graph; continuous numerical data can best be displayed using a histogram) Use the graphing functions in Excel to create an appropriate graph of the data for each variable. Remember to...
ADVERTISEMENT
Need Online Homework Help?
Ask
a QuestionGet Answers For Free
Most questions answered within 3 hours.
Most questions answered within 3 hours.
ADVERTISEMENT
ADVERTISEMENT
Active Questions
-
The specific radiocarbon activity of a sample of wood is 6.25
gms dpm/gm of carbon. The...
asked 24 seconds from now -
An aqueous magnesium chloride solution is made by dissolving
6.96 moles of MgCl2 in sufficient water...
asked 2 minutes ago -
Ken believes the average age of men who come to get a haircut at
his barber...
asked 24 minutes ago -
(Ratio Analysis): Last year Co. XYZ had sales of $ 400,000, with
“cost of goods sold”...
asked 32 minutes ago -
can someone please write the balanced chemical
equation for the synthesis of Bromoacetanilide
from;
aniline +...
asked 28 minutes ago -
1. If a corporation purchases land and building and subsequently
tears down the building and uses...
asked 39 minutes ago -
Consider a 23-year bond with 7 percent annual coupon payments.
The market rate (YTM) is 6.4...
asked 42 minutes ago -
a tuba creates a 4th harmonic of frequency 116.5 Hz. what is the
frequency of the...
asked 49 minutes ago -
A coconut mass 2kg falls from a 30m tall tree. The coconut falls
and comes to...
asked 52 minutes ago -
Group Policies
Research GROUP POLICY OBJECTS (GPO'S)
You can start in the Windows Server 2012 eBook...
asked 56 minutes ago -
software engineering
Problems.
Create a use case diagram for class registration for a
university.
Create a...
asked 56 minutes ago -
You are trying to convince your friend who wants to attend
medical school to take BY123...
asked 1 hour ago
ADVERTISEMENT