You are reading an old report about tree heights in a certain area. The report states (without...
|
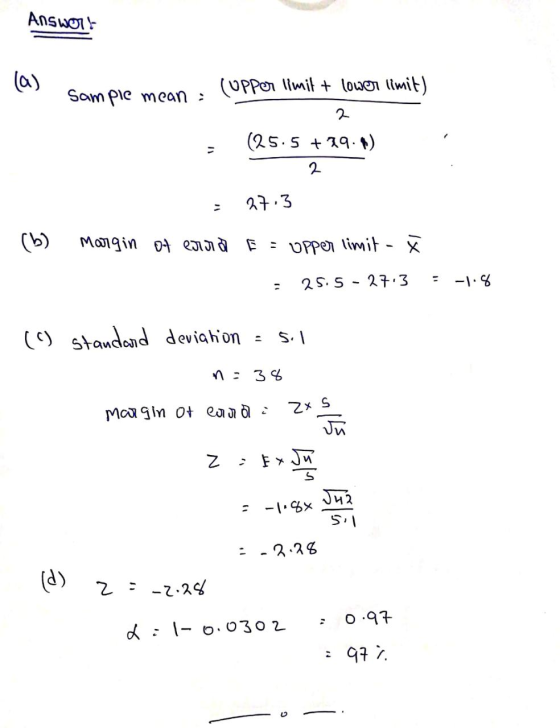
You are reading an old report about tree heights in a certain area. The report states (without stating the confidence level) that the true population mean tree height lies between 25.5 m and 29.1 m. The sample size is given as 38 trees, and the document states that the population standard deviation is assumed to be 5.1 m. You wish to determine what confidence level was used to find this confidence interval.
|
Homework Answers
Add Answer to:
You are reading an old report about tree heights in a certain
area. The report states (without...
You are reading an old report about tree heights in a certain area. The report states...
 You are reading an old report about tree heights in a certain area. The report states (without stating the confidence level) that the true population mean tree height lies between 19.2 m and 23.4 m. The sample size is given as 38 trees, and the document states that the population standard deviation is assumed to be 6.2 m. You wish to determine what confidence level was used to find this confidence interval. 1. What was the sample mean found in...
You are reading an old report about tree heights in a certain area. The report states...
 You are reading an old report about tree heights in a certain area. The report states (without stating the confidence level) that the true population mean tree height lies between 24.4 m and 26.8 m. The sample size is given as 31 trees, and the document states that the population standard deviation is assumed to be 6.3 m. You wish to determine what confidence level was used to find this confidence interval. 1. What was the sample mean found in...
Reming The You are reading an old report about tree heights in a certain area. The...
 Reming The You are reading an old report about tree heights in a certain area. The report states (without stating the confidence level) that the true population mean tree height lies between 25.8 m and 28.0 m. The sample size is given as 37 trees, and the document states that the population standard deviation is assumed to be 5.5 m. You wish to determine what confidence level was used to find this confidence interval. 1. What was the sample mean...
A sample of 18 tree heights gave a sample mean of 20.3 m. Suppose the population...
 A sample of 18 tree heights gave a sample mean of 20.3 m. Suppose the population standard deviation is 7.0 m Construct a 99% confidence interval for the population mean tree height. We can assume that the tree heights are normally distributed. Round to one digit after the decimal point. Answer: We are 99% confident that the true population mean tree height lies somewhere between metres and D3 metres.
A sample of 21 tree heights gave a sample mean of 26.1 m. Suppose the population...
A sample of 21 tree heights gave a sample mean of 26.1 m. Suppose the population standard deviation is 6.2 m. Construct a 80% confidence interval for the population mean tree height. We can assume that the tree heights are normally distributed. Round to one digit after the decimal point. Answer: We are 80% confident that the true population mean tree height lies somewhere between metres and metres.
A sample of 14 tree heights gave a sample mean of 21.5 m. Suppose the population...
 A sample of 14 tree heights gave a sample mean of 21.5 m. Suppose the population standard deviation is 5.8 m. Construct a 99% confidence interval for the population mean tree height. We can assume that the tree heights are normally distributed. Round to one digit after the decimal point. Answer: We are 99% confident that the true population mean tree height lies somewhere between metres and 3 metres.
[15 pts] Ukojaftor is the manager of a tree nursery. He measures the heights of 39...
 [15 pts] Ukojaftor is the manager of a tree nursery. He measures the heights of 39 seedlings and obtains a mean of 58.5 cm with a standard deviation of 4.3 cm. a) Construct a 95% confidence interval for these sample seedlings. b) Find the margin of error for the 95% confidence interval for the mean heights of all trees seedlings. c) |Use information from part a to fill in the following sentence: of all samples of size have sample means...
A report included the following information on the heights (in.) for non-Hispanic white females. Age 20-39...
 A report included the following information on the heights (in.) for non-Hispanic white females. Age 20-39 60 and older Sample Sample Std. Error Size Mean Mean 868 64.7 0.09 933 63. 1 0 .11 (a) Calculate a confidence interval at confidence level approximately 95% for the difference between population mean height for the younger women and that for the older women. (Use U20-39 - M 60 and older.) Interpret the interval. We are 95% confident that the true average height...
A report included the following information on the heights (in.) for non-Hispanic white females. Age Sample sample...
 A report included the following information on the heights (in.) for non-Hispanic white females. Age Sample sample sitd. Error Size Mean Mean 09 0 3.9 0.09 937 62.4 0.11 20-39 60 and older (a) Calculate a confidence interval at confidence level approximately 95% for the difference between population mean helight for the younger women and that for the older women. (Use 20-39" so and older Interpret the interval We cannot draw a conclusion from the given information. We are 95%...
The heights of newborn babies are normally distributed with an unknown population mean and a population...
The heights of newborn babies are normally distributed with an unknown population mean and a population standard deviation of 10 centimeters. A random sample of babies from the population produces a sample mean height of x¯=50 centimeters. Use Excel to find the value of z that should be used to calculate a confidence interval with a 90% confidence level. Round your answer to three decimal places.
 You are reading an old report about tree heights in a certain area. The report states (without stating the confidence level) that the true population mean tree height lies between 19.2 m and 23.4 m. The sample size is given as 38 trees, and the document states that the population standard deviation is assumed to be 6.2 m. You wish to determine what confidence level was used to find this confidence interval. 1. What was the sample mean found in...
 You are reading an old report about tree heights in a certain area. The report states (without stating the confidence level) that the true population mean tree height lies between 24.4 m and 26.8 m. The sample size is given as 31 trees, and the document states that the population standard deviation is assumed to be 6.3 m. You wish to determine what confidence level was used to find this confidence interval. 1. What was the sample mean found in...
 Reming The You are reading an old report about tree heights in a certain area. The report states (without stating the confidence level) that the true population mean tree height lies between 25.8 m and 28.0 m. The sample size is given as 37 trees, and the document states that the population standard deviation is assumed to be 5.5 m. You wish to determine what confidence level was used to find this confidence interval. 1. What was the sample mean...
 A sample of 18 tree heights gave a sample mean of 20.3 m. Suppose the population standard deviation is 7.0 m Construct a 99% confidence interval for the population mean tree height. We can assume that the tree heights are normally distributed. Round to one digit after the decimal point. Answer: We are 99% confident that the true population mean tree height lies somewhere between metres and D3 metres.
 A sample of 14 tree heights gave a sample mean of 21.5 m. Suppose the population standard deviation is 5.8 m. Construct a 99% confidence interval for the population mean tree height. We can assume that the tree heights are normally distributed. Round to one digit after the decimal point. Answer: We are 99% confident that the true population mean tree height lies somewhere between metres and 3 metres.
 [15 pts] Ukojaftor is the manager of a tree nursery. He measures the heights of 39 seedlings and obtains a mean of 58.5 cm with a standard deviation of 4.3 cm. a) Construct a 95% confidence interval for these sample seedlings. b) Find the margin of error for the 95% confidence interval for the mean heights of all trees seedlings. c) |Use information from part a to fill in the following sentence: of all samples of size have sample means...
 A report included the following information on the heights (in.) for non-Hispanic white females. Age 20-39 60 and older Sample Sample Std. Error Size Mean Mean 868 64.7 0.09 933 63. 1 0 .11 (a) Calculate a confidence interval at confidence level approximately 95% for the difference between population mean height for the younger women and that for the older women. (Use U20-39 - M 60 and older.) Interpret the interval. We are 95% confident that the true average height...
 A report included the following information on the heights (in.) for non-Hispanic white females. Age Sample sample sitd. Error Size Mean Mean 09 0 3.9 0.09 937 62.4 0.11 20-39 60 and older (a) Calculate a confidence interval at confidence level approximately 95% for the difference between population mean helight for the younger women and that for the older women. (Use 20-39" so and older Interpret the interval We cannot draw a conclusion from the given information. We are 95%...
Most questions answered within 3 hours.
-
For the following reaction, 0.128 moles of
potassium hydrogen sulfateare mixed with
0.504 moles of potassium...
asked 2 hours ago -
1. What is the present value of $400, three years in the future
if the interest...
asked 3 hours ago -
The labor force minus the number of employed equals the number
of unemployed.
a. True
b....
asked 5 hours ago -
Determine the mass in units of grams [g] of 0.49 moles [mol]
of a new fictitious...
asked 5 hours ago -
A horizontal mass of M=5kg is on a spring and stretched to
x=0.5m when released from...
asked 7 hours ago -
26 of 50
"I have worked at the Arizona Humane Society for ten years, and
have...
asked 7 hours ago -
Compare and contrast zero based budgeting and incremental (or
base year) budgeting.
asked 7 hours ago -
4 pts 10. Which of the following hypothesis would be MOST
difficult to test experimentally? Group...
asked 7 hours ago -
A business owner makes 1,000 items a day. Each day he or she
contributes eight hours...
asked 7 hours ago -
A
circular loop in the plane of a paper lies inca0.65 T magnetic
field pointing into...
asked 7 hours ago -
A business owner is trying to decide whether to buy, rent, or
lease office space and...
asked 7 hours ago -
Thermal Storage Solar heating of a house is much more efficient
if there is a way...
asked 7 hours ago