

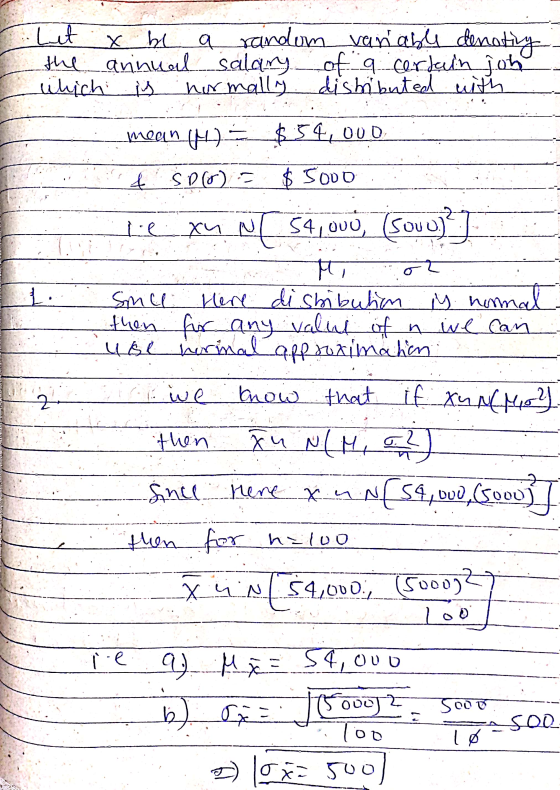
The annual salary for a certain job has a normal distribution with a mean of $54,00054,000 and a standard deviation of σ=$5000σ=$5000.
Homework Answers


Add Answer to:
The annual salary for a certain job has a normal distribution
with a mean of $54,00054,000...
Example 2 - Part 1 The annual salary for a certain job has a normal distribution...
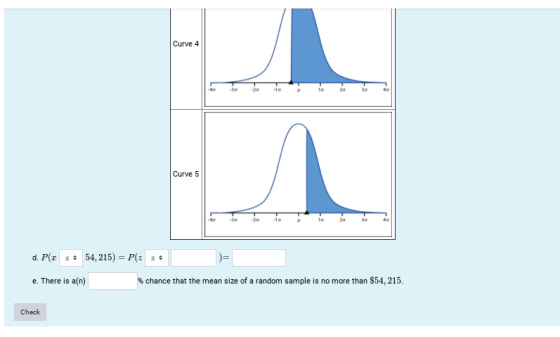
 Example 2 - Part 1 The annual salary for a certain job has a normal distribution with a mean of $54,000 and a standard deviation of o = $5000. 1. Which sample size would allow us to use the normal approximation?n= all can be used + (Click to view hint) 2. What is the probability that the mean salary of random sample of 100 workers is no more than $54, 215? a. = (Do not include the dollar sign) b....
Example 2 - Part 2 3. The annual salary for a certain job has a normal...
 Example 2 - Part 2 3. The annual salary for a certain job has a normal distribution with a mean of $54,000 and a standard deviation of o = $5000 What is the probability that the mean salary of random sample of 100 workers is more than $49,000? a. Which picture (below) shows the requested area? Curve 5 • * Curve Image Curve 1 -Jo -20 20 40 Curve 2 MacBook Air 80 FS F7 % # 3 $ 4...
Example 2 - Part 3 4. The annual salary for a certain job has a normal...
 Example 2 - Part 3 4. The annual salary for a certain job has a normal distribution with a mean of $54,000 and a standard deviation of a = $5000. What is the probability that the mean salary of a random selected sample has between $49,000 and $56, 150? a. Which picture (below) shows the requested area? Curve 3 Curve Image Curve 1 -40 -30 -10 To 2a Da 40 Curve 2 MacBook Air FT 80 F2 F4 F5 7...
b. P(49000<<44215) = P(-1<z<0.43) = (Click to view thint) chance that the mean salary of a...
 b. P(49000<<44215) = P(-1<z<0.43) = (Click to view thint) chance that the mean salary of a random sample of 100 is between 349,000 and $56, 150 e. There is a Check Example 2 - Part 3 4. The annual salary for a certain job has a normal distribution with a mean of $54,000 and a standard deviation af o = $5000. What is the probability that the mean salary of a random selected sample has between $49,000 and $56,150 a....
Suppose the lengths of the pregnancies of a certain animal are approximately normally distributed with mean...
 Suppose the lengths of the pregnancies of a certain animal are approximately normally distributed with mean = 125 days and standard deviation 12 days, Complete parts (a) through ( below. Click here to view the standard normal distribution table (page 1). Click here to view the standard normal distribution table (page 2). (b) Suppose a random sample of 20 pregnancies is obtained. Describe the sampling distribution of the sample mean length of pregnancies The sampling distribution of is with s-ando:-D...
Problem 4. The lifetime of a certain battery follows a normal distribution with a mean of...
 Problem 4. The lifetime of a certain battery follows a normal distribution with a mean of 276 and standard deviation of 20 minutes. (a) What proportion of the batteries have a lifetime more than 270 minutes? (b) Find the 90th percentile of the lifetime of these batteries. (c) We took a random sample of 100 batteries. What is the probability that the sample mean of lifetimes will be less than 270 minutes?
9) The mean salary of people living in a certain city is $37,500 with a standard...
9) The mean salary of people living in a certain city is $37,500 with a standard deviation of $2,103. A sample of n people will be selected at random from those living in the city. Find the smallest sample size n that will guarantee at least a 90% chance of the sample mean income being within $500 of the population mean income. Round your answer up to the next largest whole number.
Complete parts (a) through (d) for the sampling distribution of the sample mean shown in the...
 Complete parts (a) through (d) for the sampling distribution of the sample mean shown in the accompanying graph. Click the icon to view the graph. (a) What is the value of us? The value of his (b) What is the value of 0;? The value of oz is (c) If the sample size is n=16, what is likely true about the shape of the population? OA. The shape of the population is approximately normal. B. The shape of the population...
Chapter 7: Problem 16 Pr (1 point) The distribution of actual weights of 8-oz chocolate bars produced by a certain machine is normal with mean 7.8 ounces and standard deviation 0.15 ounces (a) Wh...
 Chapter 7: Problem 16 Pr (1 point) The distribution of actual weights of 8-oz chocolate bars produced by a certain machine is normal with mean 7.8 ounces and standard deviation 0.15 ounces (a) What is the probability that the average weight of a bar in a Simple Random Sample (SRS) with 3 of these chocolate bars is between 7.66 and 7.91 ounces? ANSWER (b) For a SRS 013 of these chocolate bars, what is the level L such that there...
I need help. PLEASE DONT USE THE STANDARD NORMAL DISTRIBUTION TABLE. use normalcdf as part of...
 I need help. PLEASE DONT USE THE STANDARD NORMAL
DISTRIBUTION TABLE. use normalcdf as part of your answer.
Thank you
The reading speed of second grade students in a large city is approximately normal, with a mean of 92 words per minute (wpm) and a standard deviation of 10 wpm. Complete parts (a) through Click here to view the standard normal distribution table (page 1 Click here to view the standard normal distribution table lage 2). Interpret this probability. Select...
I need help. PLEASE DONT USE THE STANDARD NORMAL
DISTRIBUTION TABLE. use normalcdf as part of your answer.
Thank you
The reading speed of second grade students in a large city is approximately normal, with a mean of 92 words per minute (wpm) and a standard deviation of 10 wpm. Complete parts (a) through Click here to view the standard normal distribution table (page 1 Click here to view the standard normal distribution table lage 2). Interpret this probability. Select...
 Example 2 - Part 1 The annual salary for a certain job has a normal distribution with a mean of $54,000 and a standard deviation of o = $5000. 1. Which sample size would allow us to use the normal approximation?n= all can be used + (Click to view hint) 2. What is the probability that the mean salary of random sample of 100 workers is no more than $54, 215? a. = (Do not include the dollar sign) b....
 Example 2 - Part 2 3. The annual salary for a certain job has a normal distribution with a mean of $54,000 and a standard deviation of o = $5000 What is the probability that the mean salary of random sample of 100 workers is more than $49,000? a. Which picture (below) shows the requested area? Curve 5 • * Curve Image Curve 1 -Jo -20 20 40 Curve 2 MacBook Air 80 FS F7 % # 3 $ 4...
 Example 2 - Part 3 4. The annual salary for a certain job has a normal distribution with a mean of $54,000 and a standard deviation of a = $5000. What is the probability that the mean salary of a random selected sample has between $49,000 and $56, 150? a. Which picture (below) shows the requested area? Curve 3 Curve Image Curve 1 -40 -30 -10 To 2a Da 40 Curve 2 MacBook Air FT 80 F2 F4 F5 7...
 b. P(49000<<44215) = P(-1<z<0.43) = (Click to view thint) chance that the mean salary of a random sample of 100 is between 349,000 and $56, 150 e. There is a Check Example 2 - Part 3 4. The annual salary for a certain job has a normal distribution with a mean of $54,000 and a standard deviation af o = $5000. What is the probability that the mean salary of a random selected sample has between $49,000 and $56,150 a....
 Suppose the lengths of the pregnancies of a certain animal are approximately normally distributed with mean = 125 days and standard deviation 12 days, Complete parts (a) through ( below. Click here to view the standard normal distribution table (page 1). Click here to view the standard normal distribution table (page 2). (b) Suppose a random sample of 20 pregnancies is obtained. Describe the sampling distribution of the sample mean length of pregnancies The sampling distribution of is with s-ando:-D...
 Problem 4. The lifetime of a certain battery follows a normal distribution with a mean of 276 and standard deviation of 20 minutes. (a) What proportion of the batteries have a lifetime more than 270 minutes? (b) Find the 90th percentile of the lifetime of these batteries. (c) We took a random sample of 100 batteries. What is the probability that the sample mean of lifetimes will be less than 270 minutes?
 Complete parts (a) through (d) for the sampling distribution of the sample mean shown in the accompanying graph. Click the icon to view the graph. (a) What is the value of us? The value of his (b) What is the value of 0;? The value of oz is (c) If the sample size is n=16, what is likely true about the shape of the population? OA. The shape of the population is approximately normal. B. The shape of the population...
 Chapter 7: Problem 16 Pr (1 point) The distribution of actual weights of 8-oz chocolate bars produced by a certain machine is normal with mean 7.8 ounces and standard deviation 0.15 ounces (a) What is the probability that the average weight of a bar in a Simple Random Sample (SRS) with 3 of these chocolate bars is between 7.66 and 7.91 ounces? ANSWER (b) For a SRS 013 of these chocolate bars, what is the level L such that there...
 I need help. PLEASE DONT USE THE STANDARD NORMAL
DISTRIBUTION TABLE. use normalcdf as part of your answer.
Thank you
The reading speed of second grade students in a large city is approximately normal, with a mean of 92 words per minute (wpm) and a standard deviation of 10 wpm. Complete parts (a) through Click here to view the standard normal distribution table (page 1 Click here to view the standard normal distribution table lage 2). Interpret this probability. Select...
I need help. PLEASE DONT USE THE STANDARD NORMAL
DISTRIBUTION TABLE. use normalcdf as part of your answer.
Thank you
The reading speed of second grade students in a large city is approximately normal, with a mean of 92 words per minute (wpm) and a standard deviation of 10 wpm. Complete parts (a) through Click here to view the standard normal distribution table (page 1 Click here to view the standard normal distribution table lage 2). Interpret this probability. Select...
Most questions answered within 3 hours.
-
A business executive has the option to invest money in two
plans: Plan A guarantees that...
asked 1 hour ago -
Hello, can someone please help me answer this question?
How much heat is absorbed by a...
asked 1 hour ago -
. A marketing researcher conducted a survey of 25 shoppers
randomly selected at the local mall...
asked 1 hour ago -
Create an comprehensive response to the
following:
Antimicrobial agents work on a multitude of microbes (bacteria,...
asked 2 hours ago -
6.13 LAB: Step counter. Section 6.3.
A pedometer treats walking 2,000 steps as walking 1 mile....
asked 1 hour ago -
(14.2) A block of mass m = 10 kg riding on a frictionless
horizontal plane is...
asked 2 hours ago -
Use any search engine to search for articles about Starbucks
partnership with Tata Companies in India...
asked 1 hour ago -
Let’s say that for some reason Bank Excess Reserves suddenly
increase sharply. What effect would this...
asked 2 hours ago -
Given:
Curent Assets: $600,000
Total Assets: $2,600,000
Current Liabilities: $500,000
Total Liabilities: $1,700,000
What is the...
asked 2 hours ago -
1. What is a “Bankster”? What is insider trading? Why is it
illegal?
2. What is...
asked 2 hours ago -
A transverse wave on a cord is given by
D(x,t)=0.18sin(2.7x−61.0t), where Dand x are in m...
asked 2 hours ago -
ASSIGNMENT
ANSWER ANY TWO OF THE FOLLOWING IN 2-3 PARAGRAPHS OF EACH
QUESTION.
1: Where is...
asked 2 hours ago