Need help to write the Explain the output results and null hypothesis between two variables below.

Below are the two variables that I use for the Output above.
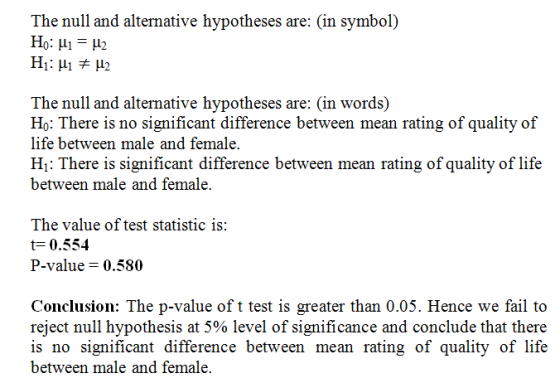
Q1 Overall, how would you rate the quality of life for you and your family today? Would you say it is... excellent, very good, good, fair or poor?
1 Excellent
2 Very good
3 Good
4 Fair
5 Poor
8 (DO NOT READ) Don’t know
9 (DO NOT READ) Refused
SEX RECORD RESPONDENT SEX (DO NOT ASK)
1 Male
2 Female
Homework Answers
Add Answer to:
Need help to write the Explain the output results and null
hypothesis between two variables below....
The output below is for a t-test for the hypothesis: Individuals living in bad neighborhoods commit...
 The output below is for a t-test for the hypothesis: Individuals
living in bad neighborhoods commit more crime than those living in
good neighborhoods. The data in the Group Statistics section
provides you with the average number of crimes committed by
individuals living in good and bad neighborhoods and the standard
deviation of this same variable. The findings of significance are
located in the Independent Samples Test section. Pay particular
attention to the "t" column and the "Sig (2-tailed)"column. The...
The output below is for a t-test for the hypothesis: Individuals
living in bad neighborhoods commit more crime than those living in
good neighborhoods. The data in the Group Statistics section
provides you with the average number of crimes committed by
individuals living in good and bad neighborhoods and the standard
deviation of this same variable. The findings of significance are
located in the Independent Samples Test section. Pay particular
attention to the "t" column and the "Sig (2-tailed)"column. The...
The null hypothesis states there will be no difference in scores on the ADS between face-to-face...
The null hypothesis states there will be no difference in scores on the ADS between face-to-face counseling and video conference counseling. The results are t(38) = 0.258, p = .798. Group Statistics Group N Mean Std. Deviation Std. Error Mean ADS face to face video 20 20 9.2500 9.0000 3.14350 2.97357 .70291 .66491 Independent Samples Test Levene’s Test for Equality of variance t-test for Equality of Means F Sig. t df Sig. (2-tailed) Mean Difference Std. Error Difference 95% Confidence...
QUESTION 1 "Look at the SPSS output below. Given a two-tailed test and an alpha of...
 QUESTION 1 "Look at the SPSS output below. Given a two-tailed test and an alpha of 0.01, what would the appropriate APA-style phrase be?" Independent Samples Test Levene's Test for Equality of Variances t-test for Equality of Means sig Mean Difference Std. Error Difference 95% Confidence Interval of the Mean Lower Upper sig (2-tailed) TAPSPEED 319 582 -2.845 13 .014 -14.00 4.92 -24.63 -3.37 Equal variances assumed Equal variances not assumed -2.927 11.865 013 -14.00 4.78 -24.44 -3.56 O "t...
What can you conclude from these results? Is Betty’s hypothesis supported? Betty has the following hypothesis:...
 What can you conclude from these results? Is Betty’s
hypothesis supported?
Betty has the following hypothesis: Women are more likely to believe that hard work leads to success than men are. Betty ran a comparison of means test on survey data and had the following results from SPSS. The variable about "hard work" ranges from 1 to 10 with 1 being the strongest belief that hard work brings success and 10 being the strongest belief that hard work does NOT...
What can you conclude from these results? Is Betty’s
hypothesis supported?
Betty has the following hypothesis: Women are more likely to believe that hard work leads to success than men are. Betty ran a comparison of means test on survey data and had the following results from SPSS. The variable about "hard work" ranges from 1 to 10 with 1 being the strongest belief that hard work brings success and 10 being the strongest belief that hard work does NOT...
spss output for questions 34, 35 & 36 Group Statistics Gender Mean Std. Deviation Std. Error Mean Loneliness Female 112 35.0000 86394 44 35.0000 7.95335 Independent Samples Test Levene's...
 spss output for questions 34, 35 & 36 Group Statistics Gender Mean Std. Deviation Std. Error Mean Loneliness Female 112 35.0000 86394 44 35.0000 7.95335 Independent Samples Test Levene's Test for Equality of Variances Hest for Equality of Means 95% Confdence Interval of the Sig. (2 Mean Std. Emor Ditlerence df taled) Difference DiflerenceLower Upper Sig. Loneliness Equal variances 1021 .0001 1541 10여 .000001100707|-329329 320320 2.7 assumed 091.000 00000 151867301416 3.01416 Equal variances not assumed 34. For the above SPSS...
I need some assistance on an SPSS assignment. My profession literally never teachers so I'm really...
I need some assistance on an SPSS assignment. My profession literally never teachers so I'm really lost. All I have a confusing textbook to try to self teach myself. 0.5 pts.) Calculated. Use the provided formula as the two groups have a different sample size. Show me all the steps you follow to get d so that I can give you a partial credit when your answer is incorrect. d= t ( n1 + n2/ square root of df...
Please help!! I'm so lost! • Purpose To learn how to read the output of the...
 Please help!! I'm so lost!
• Purpose To learn how to read the output of the 2-independent-sample t-test and apply the results to a scenario Scenano. You are working at a summer camp near Grassy Key, FL, for autistic children Their parents have given permission for you to observe the children and rate their responsiveness in various stimulating situations. You would like to find out whether interaction with dolphins would affect the children's responsiveness. You randomly assign half the children...
Please help!! I'm so lost!
• Purpose To learn how to read the output of the 2-independent-sample t-test and apply the results to a scenario Scenano. You are working at a summer camp near Grassy Key, FL, for autistic children Their parents have given permission for you to observe the children and rate their responsiveness in various stimulating situations. You would like to find out whether interaction with dolphins would affect the children's responsiveness. You randomly assign half the children...
please who can help with this question '. For the following questions, please refer to the...
 please who can help with this question
'. For the following questions, please refer to the SPS wing questions, please refer to the SPSS output file below. Use a .05 a. On average, how much would we expect one group to differ from ano we expect one group to differ from another by chance? (1 point) the assumption of homogeneity of variances satisfied? How did you test the assumption? (2 points) c. Is there a significant difference between groups on...
please who can help with this question
'. For the following questions, please refer to the SPS wing questions, please refer to the SPSS output file below. Use a .05 a. On average, how much would we expect one group to differ from ano we expect one group to differ from another by chance? (1 point) the assumption of homogeneity of variances satisfied? How did you test the assumption? (2 points) c. Is there a significant difference between groups on...
spss output for questions 34, 35 & 36 Group Statistics Gender Mean Std. Deviation Std. Ermor Mean Loneliness Female 112 35.0000 44 35.0000 7.95335 Independent Samples Test Levene's Test...
 spss output for questions 34, 35 & 36 Group Statistics Gender Mean Std. Deviation Std. Ermor Mean Loneliness Female 112 35.0000 44 35.0000 7.95335 Independent Samples Test Levene's Test for Equality of Variances Hest for Equality of Means 95% Confdence Interval of the Sig (2 Mean Std. Emor Ditterence df taled) Difference DilerenceLower Upper , 54 1.000 000000 1,039320 Loneliness Equal variances 02000 2.709 assumed 000 969541 1.000丨 .00000| 151867|-301416| 301410 Equal variances 06. not assumed 31. For the above...
a researcher wants to know whether males and females consider personality or looks ate more important in mate selection. He decides to run a 2X2 ANOVA to examine the differences between what quality a...
 a
researcher wants to know whether males and females consider
personality or looks ate more important in mate selection. He
decides to run a 2X2 ANOVA to examine the differences between what
quality attracts people more( personality/looks) and whether gender
(male/female) impacts the difference anwer the following questions
df Score (M Equal variances assumed 036 8494.584 233 Equal variances not 4.657 182.973 Independent Samples Test Hest for Equality of Means 95% Mean Std. Error Difference しDifference Sig (2-tailed) Lower Score...
a
researcher wants to know whether males and females consider
personality or looks ate more important in mate selection. He
decides to run a 2X2 ANOVA to examine the differences between what
quality attracts people more( personality/looks) and whether gender
(male/female) impacts the difference anwer the following questions
df Score (M Equal variances assumed 036 8494.584 233 Equal variances not 4.657 182.973 Independent Samples Test Hest for Equality of Means 95% Mean Std. Error Difference しDifference Sig (2-tailed) Lower Score...
 The output below is for a t-test for the hypothesis: Individuals
living in bad neighborhoods commit more crime than those living in
good neighborhoods. The data in the Group Statistics section
provides you with the average number of crimes committed by
individuals living in good and bad neighborhoods and the standard
deviation of this same variable. The findings of significance are
located in the Independent Samples Test section. Pay particular
attention to the "t" column and the "Sig (2-tailed)"column. The...
The output below is for a t-test for the hypothesis: Individuals
living in bad neighborhoods commit more crime than those living in
good neighborhoods. The data in the Group Statistics section
provides you with the average number of crimes committed by
individuals living in good and bad neighborhoods and the standard
deviation of this same variable. The findings of significance are
located in the Independent Samples Test section. Pay particular
attention to the "t" column and the "Sig (2-tailed)"column. The...
 QUESTION 1 "Look at the SPSS output below. Given a two-tailed test and an alpha of 0.01, what would the appropriate APA-style phrase be?" Independent Samples Test Levene's Test for Equality of Variances t-test for Equality of Means sig Mean Difference Std. Error Difference 95% Confidence Interval of the Mean Lower Upper sig (2-tailed) TAPSPEED 319 582 -2.845 13 .014 -14.00 4.92 -24.63 -3.37 Equal variances assumed Equal variances not assumed -2.927 11.865 013 -14.00 4.78 -24.44 -3.56 O "t...
 What can you conclude from these results? Is Betty’s
hypothesis supported?
Betty has the following hypothesis: Women are more likely to believe that hard work leads to success than men are. Betty ran a comparison of means test on survey data and had the following results from SPSS. The variable about "hard work" ranges from 1 to 10 with 1 being the strongest belief that hard work brings success and 10 being the strongest belief that hard work does NOT...
What can you conclude from these results? Is Betty’s
hypothesis supported?
Betty has the following hypothesis: Women are more likely to believe that hard work leads to success than men are. Betty ran a comparison of means test on survey data and had the following results from SPSS. The variable about "hard work" ranges from 1 to 10 with 1 being the strongest belief that hard work brings success and 10 being the strongest belief that hard work does NOT...
 spss output for questions 34, 35 & 36 Group Statistics Gender Mean Std. Deviation Std. Error Mean Loneliness Female 112 35.0000 86394 44 35.0000 7.95335 Independent Samples Test Levene's Test for Equality of Variances Hest for Equality of Means 95% Confdence Interval of the Sig. (2 Mean Std. Emor Ditlerence df taled) Difference DiflerenceLower Upper Sig. Loneliness Equal variances 1021 .0001 1541 10여 .000001100707|-329329 320320 2.7 assumed 091.000 00000 151867301416 3.01416 Equal variances not assumed 34. For the above SPSS...
 Please help!! I'm so lost!
• Purpose To learn how to read the output of the 2-independent-sample t-test and apply the results to a scenario Scenano. You are working at a summer camp near Grassy Key, FL, for autistic children Their parents have given permission for you to observe the children and rate their responsiveness in various stimulating situations. You would like to find out whether interaction with dolphins would affect the children's responsiveness. You randomly assign half the children...
Please help!! I'm so lost!
• Purpose To learn how to read the output of the 2-independent-sample t-test and apply the results to a scenario Scenano. You are working at a summer camp near Grassy Key, FL, for autistic children Their parents have given permission for you to observe the children and rate their responsiveness in various stimulating situations. You would like to find out whether interaction with dolphins would affect the children's responsiveness. You randomly assign half the children...
 please who can help with this question
'. For the following questions, please refer to the SPS wing questions, please refer to the SPSS output file below. Use a .05 a. On average, how much would we expect one group to differ from ano we expect one group to differ from another by chance? (1 point) the assumption of homogeneity of variances satisfied? How did you test the assumption? (2 points) c. Is there a significant difference between groups on...
please who can help with this question
'. For the following questions, please refer to the SPS wing questions, please refer to the SPSS output file below. Use a .05 a. On average, how much would we expect one group to differ from ano we expect one group to differ from another by chance? (1 point) the assumption of homogeneity of variances satisfied? How did you test the assumption? (2 points) c. Is there a significant difference between groups on...
 spss output for questions 34, 35 & 36 Group Statistics Gender Mean Std. Deviation Std. Ermor Mean Loneliness Female 112 35.0000 44 35.0000 7.95335 Independent Samples Test Levene's Test for Equality of Variances Hest for Equality of Means 95% Confdence Interval of the Sig (2 Mean Std. Emor Ditterence df taled) Difference DilerenceLower Upper , 54 1.000 000000 1,039320 Loneliness Equal variances 02000 2.709 assumed 000 969541 1.000丨 .00000| 151867|-301416| 301410 Equal variances 06. not assumed 31. For the above...
 a
researcher wants to know whether males and females consider
personality or looks ate more important in mate selection. He
decides to run a 2X2 ANOVA to examine the differences between what
quality attracts people more( personality/looks) and whether gender
(male/female) impacts the difference anwer the following questions
df Score (M Equal variances assumed 036 8494.584 233 Equal variances not 4.657 182.973 Independent Samples Test Hest for Equality of Means 95% Mean Std. Error Difference しDifference Sig (2-tailed) Lower Score...
a
researcher wants to know whether males and females consider
personality or looks ate more important in mate selection. He
decides to run a 2X2 ANOVA to examine the differences between what
quality attracts people more( personality/looks) and whether gender
(male/female) impacts the difference anwer the following questions
df Score (M Equal variances assumed 036 8494.584 233 Equal variances not 4.657 182.973 Independent Samples Test Hest for Equality of Means 95% Mean Std. Error Difference しDifference Sig (2-tailed) Lower Score...
Most questions answered within 3 hours.
-
Write a program to solve the Josephus problem, with the following
modification:
Sample Input:
./a.out n...
asked 5 minutes ago -
At the start of a CD it is spinning at a rate of 525 rpm
(revolutions...
asked 40 minutes ago -
4. Without doing any calculations, predict whether the observed
∆T would increase, decrease or remain the...
asked 1 hour ago -
Based on the range, which of the following sets of scores has
the greatest variability? 3,...
asked 3 hours ago -
Ripples in a pond travel at a velocity of 3 m/s with one peak
passing a...
asked 2 hours ago -
A man stands on the roof of a building of height 13.0 mm and
throws a...
asked 2 hours ago -
The extent to which assets are financed by borrowed funds and
other liabilities is indicated by:...
asked 4 hours ago -
Explain in detail
Germany is the fifth largest economy
explain what goods and services Germany specializes...
asked 4 hours ago -
The density of platinum is 21.45 g/mL. If a cube of platinum
with a mass of...
asked 4 hours ago -
Accounts Receivable
Sales
A/R Posting
Extended Sales Invoice
Packing Slip
Compare invoice to packing slip 2...
asked 4 hours ago -
Michaella, age 23, is a full-time law student and is claimed by
her parents as a...
asked 4 hours ago -
Why are polymers not typically casted into products?
asked 4 hours ago