I need some help with this question.

Homework Answers

Add Answer to:
I need some help with this question.
Create a table of values and an associated graph...
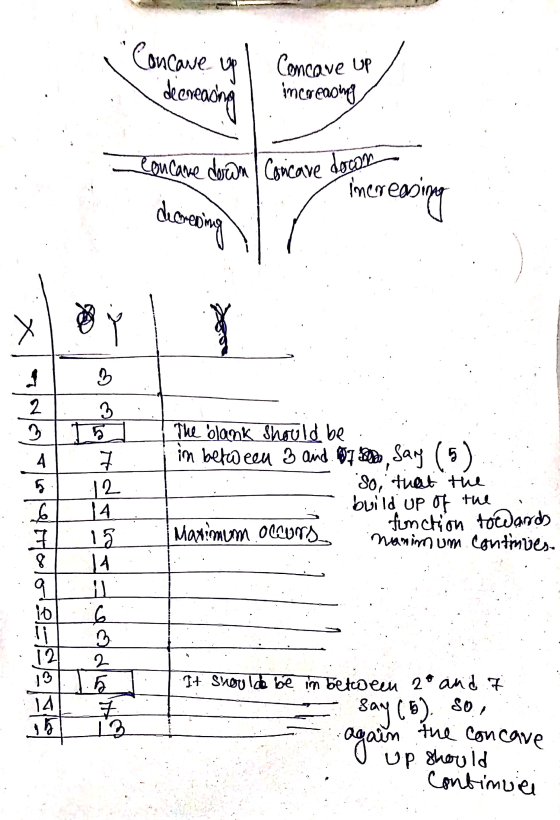
Create a table of values and an associated graph that are concave up twice and concave...
 Create a table of values and an associated graph that are concave up twice and concave down once. 24 * 0+
I need to create a C++ program to simulate a Round Robin Tournament. For example: if...
I need to create a C++ program to simulate a Round Robin Tournament. For example: if a user enters 4, a 4 team tournament would output: 1 2 3 4 2 1 4 3 3 4 1 2 4 3 2 1 My goal is to create this program using a two dimentional array, however I am unsure how to go about doing initializing everything. How do I write a constructor for this? The following is the class declaration I...
I need help on this please. I need to create an outline for inform to speech....
I need help on this please. I need to create an outline for inform to speech. Your task is to prepare a 5 minute speech to inform. This information can be about the role of nurses to the autistic children. 1. Audience Analysis Questions 2. tiltle 3. general purpose 4. specific purpose 5. attention 6. Relate to Audience Tells listeners how they will benefit from hearing your speech. Uses “you” language. May refer to audience analysis survey results. 7. relate...
I need help in SQL management studio please. Question: Create the same query as query 5,...
I need help in SQL management studio please. Question: Create the same query as query 5, but only include artists if they have 'Pop' Genre. Previous question: Create a list of all composers and artists in your database. Include two columns in your record set (the names of the returned columns are in brackets): 'Composer/Artist Name' and 'Type' (which will indicate whether your results are from the composer or artist table). Order by 'Composer/Artist Name'. This is the answer for...
i need help with this page thanks Student's Name Solve and graph the compound inequality, if possible. 11. -...
 i need help with this page
thanks
Student's Name Solve and graph the compound inequality, if possible. 11. -6 <3(x +4) s 18 -8 Solve the equation, if possible. 12.-316n-21 +5=8 Label each statement as "true" or "false." If "Talse," correct the underlined portion. 13. If 3 <x, ten 3 + y<X+y 14. If bw -7K-3, then w-7-3 or w-73 15. If -4<-2t+ 6< 10, then 21+62-5 16. If ly + 81+226, then y + 8 =24 Translate and solve....
i need help with this page
thanks
Student's Name Solve and graph the compound inequality, if possible. 11. -6 <3(x +4) s 18 -8 Solve the equation, if possible. 12.-316n-21 +5=8 Label each statement as "true" or "false." If "Talse," correct the underlined portion. 13. If 3 <x, ten 3 + y<X+y 14. If bw -7K-3, then w-7-3 or w-73 15. If -4<-2t+ 6< 10, then 21+62-5 16. If ly + 81+226, then y + 8 =24 Translate and solve....
Need to create pH vs. volume graph and fill out table from experimental data below. I have posted...
 Need to create pH vs. volume graph and fill out table
from experimental data below. I have posted the pH vs. volume graph
I have created, not sure if it is right, need to help finding
stoichiometric point. I am also required to fill out the table
posted below. MY LAB GROUP BAILED ON ME PLZ
HELP!!!!!!!!!!!!!!!!!!!!!!!!!
Volume (mL)
pH
0
4.24
1
4.28
2
4.33
3
4.37
4
4.4
5
4.45
6
4.49
7
4.52
8
4.55
9
4.58...
Need to create pH vs. volume graph and fill out table
from experimental data below. I have posted the pH vs. volume graph
I have created, not sure if it is right, need to help finding
stoichiometric point. I am also required to fill out the table
posted below. MY LAB GROUP BAILED ON ME PLZ
HELP!!!!!!!!!!!!!!!!!!!!!!!!!
Volume (mL)
pH
0
4.24
1
4.28
2
4.33
3
4.37
4
4.4
5
4.45
6
4.49
7
4.52
8
4.55
9
4.58...
Table 4. 1975 cohort of G. conden x 5. To visualize survivorship in a graph, it...
 Table 4. 1975 cohort of G. conden x 5. To visualize survivorship in a graph, it is often helpful to calculate the log of survivorship so that the graphed data are more reasonably scaled. Complete Table 4 to the right to log-transform the survivorship data for the 1975 cohort of G. scandens (round to the hundredths place). 0 Nx 82 42 1 2 3 4. Use your values from Table 4 and the grid below to create a survivorship curve...
I really do not understand how to read these.... If I can get some help that...
 I really do not understand how
to read these.... If I can get some help that would be
amazing!!!
DLL 00 KIMAX an w M 9 ma N N 00 a w 00 N O 16 16 15 - 15 0.6 14 14 13 13 0.5 12 12 11 11 10 10 10 KIMAX 10.4 9 8 0.3 பாப்பா பாடல் 7 6 5 0.2 3 0.1 2 1 1 cm A cm B cm C m Gradations: A B C...
I really do not understand how
to read these.... If I can get some help that would be
amazing!!!
DLL 00 KIMAX an w M 9 ma N N 00 a w 00 N O 16 16 15 - 15 0.6 14 14 13 13 0.5 12 12 11 11 10 10 10 KIMAX 10.4 9 8 0.3 பாப்பா பாடல் 7 6 5 0.2 3 0.1 2 1 1 cm A cm B cm C m Gradations: A B C...
I need help with this excercise. its for population parameters for Terrestrial Ecology. points) Life Tables...
 I
need help with this excercise.
its for population parameters for Terrestrial Ecology.
points) Life Tables and Survivorship Curves Life Table for the 1978 cohort of Geospiza scandens on Isla Daphne (Galapagos) Age Class n. 1d. 0-1 210 1-2 91 2-3 78 70 4-5 65 5-6 62 6-7 42 7-8 23 8-9 15 9-10 14 10-11 11 11-12 10 12-13 4 133 Survivorship Curve for 1978 Cohort of Geospiza scandens * 0.1 0.01 0 1 2 3 4 5 6...
I
need help with this excercise.
its for population parameters for Terrestrial Ecology.
points) Life Tables and Survivorship Curves Life Table for the 1978 cohort of Geospiza scandens on Isla Daphne (Galapagos) Age Class n. 1d. 0-1 210 1-2 91 2-3 78 70 4-5 65 5-6 62 6-7 42 7-8 23 8-9 15 9-10 14 10-11 11 11-12 10 12-13 4 133 Survivorship Curve for 1978 Cohort of Geospiza scandens * 0.1 0.01 0 1 2 3 4 5 6...
need answers for the 5,6 and 7 by using the table in first picture 2) You will fill out the table below. You are ta...
 need answers for the 5,6 and 7 by using the table in first
picture
2) You will fill out the table below. You are taking your speed at that exact moment (don't give some sort of average speed over the whole minute) Time Speed 1 2 32 3 41 4 43 6 14 7 12 miles Per hour 73 9 74 10 11 71 12 75 13 16 14 77 15 16 So 46 20 17 18 19 20 22...
need answers for the 5,6 and 7 by using the table in first
picture
2) You will fill out the table below. You are taking your speed at that exact moment (don't give some sort of average speed over the whole minute) Time Speed 1 2 32 3 41 4 43 6 14 7 12 miles Per hour 73 9 74 10 11 71 12 75 13 16 14 77 15 16 So 46 20 17 18 19 20 22...
 Create a table of values and an associated graph that are concave up twice and concave down once. 24 * 0+
 i need help with this page
thanks
Student's Name Solve and graph the compound inequality, if possible. 11. -6 <3(x +4) s 18 -8 Solve the equation, if possible. 12.-316n-21 +5=8 Label each statement as "true" or "false." If "Talse," correct the underlined portion. 13. If 3 <x, ten 3 + y<X+y 14. If bw -7K-3, then w-7-3 or w-73 15. If -4<-2t+ 6< 10, then 21+62-5 16. If ly + 81+226, then y + 8 =24 Translate and solve....
i need help with this page
thanks
Student's Name Solve and graph the compound inequality, if possible. 11. -6 <3(x +4) s 18 -8 Solve the equation, if possible. 12.-316n-21 +5=8 Label each statement as "true" or "false." If "Talse," correct the underlined portion. 13. If 3 <x, ten 3 + y<X+y 14. If bw -7K-3, then w-7-3 or w-73 15. If -4<-2t+ 6< 10, then 21+62-5 16. If ly + 81+226, then y + 8 =24 Translate and solve....
 Need to create pH vs. volume graph and fill out table
from experimental data below. I have posted the pH vs. volume graph
I have created, not sure if it is right, need to help finding
stoichiometric point. I am also required to fill out the table
posted below. MY LAB GROUP BAILED ON ME PLZ
HELP!!!!!!!!!!!!!!!!!!!!!!!!!
Volume (mL)
pH
0
4.24
1
4.28
2
4.33
3
4.37
4
4.4
5
4.45
6
4.49
7
4.52
8
4.55
9
4.58...
Need to create pH vs. volume graph and fill out table
from experimental data below. I have posted the pH vs. volume graph
I have created, not sure if it is right, need to help finding
stoichiometric point. I am also required to fill out the table
posted below. MY LAB GROUP BAILED ON ME PLZ
HELP!!!!!!!!!!!!!!!!!!!!!!!!!
Volume (mL)
pH
0
4.24
1
4.28
2
4.33
3
4.37
4
4.4
5
4.45
6
4.49
7
4.52
8
4.55
9
4.58...
 Table 4. 1975 cohort of G. conden x 5. To visualize survivorship in a graph, it is often helpful to calculate the log of survivorship so that the graphed data are more reasonably scaled. Complete Table 4 to the right to log-transform the survivorship data for the 1975 cohort of G. scandens (round to the hundredths place). 0 Nx 82 42 1 2 3 4. Use your values from Table 4 and the grid below to create a survivorship curve...
 I really do not understand how
to read these.... If I can get some help that would be
amazing!!!
DLL 00 KIMAX an w M 9 ma N N 00 a w 00 N O 16 16 15 - 15 0.6 14 14 13 13 0.5 12 12 11 11 10 10 10 KIMAX 10.4 9 8 0.3 பாப்பா பாடல் 7 6 5 0.2 3 0.1 2 1 1 cm A cm B cm C m Gradations: A B C...
I really do not understand how
to read these.... If I can get some help that would be
amazing!!!
DLL 00 KIMAX an w M 9 ma N N 00 a w 00 N O 16 16 15 - 15 0.6 14 14 13 13 0.5 12 12 11 11 10 10 10 KIMAX 10.4 9 8 0.3 பாப்பா பாடல் 7 6 5 0.2 3 0.1 2 1 1 cm A cm B cm C m Gradations: A B C...
 I
need help with this excercise.
its for population parameters for Terrestrial Ecology.
points) Life Tables and Survivorship Curves Life Table for the 1978 cohort of Geospiza scandens on Isla Daphne (Galapagos) Age Class n. 1d. 0-1 210 1-2 91 2-3 78 70 4-5 65 5-6 62 6-7 42 7-8 23 8-9 15 9-10 14 10-11 11 11-12 10 12-13 4 133 Survivorship Curve for 1978 Cohort of Geospiza scandens * 0.1 0.01 0 1 2 3 4 5 6...
I
need help with this excercise.
its for population parameters for Terrestrial Ecology.
points) Life Tables and Survivorship Curves Life Table for the 1978 cohort of Geospiza scandens on Isla Daphne (Galapagos) Age Class n. 1d. 0-1 210 1-2 91 2-3 78 70 4-5 65 5-6 62 6-7 42 7-8 23 8-9 15 9-10 14 10-11 11 11-12 10 12-13 4 133 Survivorship Curve for 1978 Cohort of Geospiza scandens * 0.1 0.01 0 1 2 3 4 5 6...
 need answers for the 5,6 and 7 by using the table in first
picture
2) You will fill out the table below. You are taking your speed at that exact moment (don't give some sort of average speed over the whole minute) Time Speed 1 2 32 3 41 4 43 6 14 7 12 miles Per hour 73 9 74 10 11 71 12 75 13 16 14 77 15 16 So 46 20 17 18 19 20 22...
need answers for the 5,6 and 7 by using the table in first
picture
2) You will fill out the table below. You are taking your speed at that exact moment (don't give some sort of average speed over the whole minute) Time Speed 1 2 32 3 41 4 43 6 14 7 12 miles Per hour 73 9 74 10 11 71 12 75 13 16 14 77 15 16 So 46 20 17 18 19 20 22...
Most questions answered within 3 hours.
-
Calculate Ecell for the following reaction and conditions: 0.50
M Br2 (aq), 0.10 M Pb+2 (aq),...
asked 12 minutes ago -
There can be more than one correct answer.
Hypophysiotropic hormones:
A. released by the hypothalamus
B....
asked 17 minutes ago -
Scott Ruskin is the CEO of Decatur Materials. The company has
been struggling for the last...
asked 15 minutes ago -
If you were conducting a study involving twins regarding
genetics and/or upbringing, which would you use?...
asked 37 minutes ago -
Part 1- Inventory: You own a toy company and
you are producing wooden rocking horses. Assume...
asked 46 minutes ago -
What is aromaticity?
Identify aromatic molecules, especially those containing O, N,
S and B
asked 49 minutes ago -
A rubber solid circular wheel of uniform density spins about it
axis at rate of 60...
asked 1 hour ago -
DNA evidence from an early human skeleton in Britain, shows that
early inhabitants of were blue...
asked 52 minutes ago -
Financial data for Joel de Paris, Inc., for last year
follow:
Joel de Paris, Inc.
Balance...
asked 1 hour ago -
To practice Problem-Solving Strategy 19.1 Work in Ideal-gas
Processes.
A cylinder with initial volume V contains...
asked 1 hour ago -
Depreciation for Partial Periods Bean Delivery Company purchased
a new delivery truck for $35,400 on April...
asked 1 hour ago -
Q 5.23:
Jonathan has been doing calculations to determine a missing
component. So far he has...
asked 1 hour ago