For each variable of interest – Percent Time Asleep and Longevity – create a grouped frequency...
For each variable of interest – Percent Time Asleep and Longevity – create a grouped frequency histogram. For each histogram, use a class width of 10; use a lower limit of 0 for Percent Time Asleep and 15 for Longevity. Each histogram must include an informative title, along with correct labels for both axes. For each histogram, include a paragraph that answers each of the following questions:
- Is the histogram symmetric, skewed to the left, or skewed to the right?
- How many peaks does it have, and where are they located?
- Does it have any gaps? If so, where are they?
Do any classes appear to contain unusual values? If so, which ones?
| Pct Time Asleep | Longevity |
| 22 | 35 |
| 9 | 37 |
| 49 | 49 |
| 1 | 46 |
| 23 | 63 |
| 83 | 39 |
| 23 | 46 |
| 15 | 56 |
| 9 | 63 |
| 81 | 65 |
| 12 | 56 |
| 15 | 65 |
| 37 | 70 |
| 24 | 63 |
| 26 | 65 |
| 17 | 70 |
| 14 | 77 |
| 14 | 81 |
| 6 | 86 |
| 25 | 70 |
| 18 | 70 |
| 26 | 77 |
| 24 | 77 |
| 29 | 81 |
| 27 | 77 |
| 18 | 40 |
| 6 | 37 |
| 19 | 44 |
| 7 | 47 |
| 16 | 47 |
| 13 | 47 |
| 35 | 68 |
| 2 | 47 |
| 35 | 54 |
| 6 | 61 |
| 15 | 71 |
| 14 | 75 |
| 18 | 89 |
| 50 | 58 |
| 25 | 59 |
| 10 | 62 |
| 33 | 79 |
| 43 | 96 |
| 35 | 58 |
| 17 | 62 |
| 27 | 70 |
| 22 | 72 |
| 16 | 75 |
| 20 | 96 |
| 37 | 75 |
| 23 | 46 |
| 4 | 42 |
| 20 | 65 |
| 42 | 46 |
| 9 | 58 |
| 32 | 42 |
| 66 | 48 |
| 28 | 58 |
| 10 | 50 |
| 4 | 80 |
| 12 | 63 |
| 17 | 65 |
| 12 | 70 |
| 23 | 70 |
| 40 | 72 |
| 18 | 97 |
| 10 | 46 |
| 38 | 56 |
| 7 | 70 |
| 23 | 70 |
| 36 | 72 |
| 9 | 76 |
| 21 | 90 |
| 62 | 76 |
| 36 | 92 |
| 23 | 21 |
| 62 | 40 |
| 28 | 44 |
| 18 | 54 |
| 10 | 36 |
| 28 | 40 |
| 22 | 56 |
| 29 | 60 |
| 15 | 48 |
| 73 | 53 |
| 10 | 60 |
| 5 | 60 |
| 13 | 65 |
| 27 | 68 |
| 20 | 60 |
| 21 | 81 |
| 12 | 81 |
| 49 | 48 |
| 17 | 48 |
| 22 | 56 |
| 71 | 68 |
| 17 | 75 |
| 10 | 81 |
| 24 | 48 |
| 18 | 68 |
| 34 | 16 |
| 6 | 19 |
| 4 | 19 |
| 22 | 32 |
| 28 | 33 |
| 31 | 33 |
| 16 | 30 |
| 27 | 42 |
| 8 | 42 |
| 32 | 33 |
| 20 | 26 |
| 35 | 30 |
| 12 | 40 |
| 14 | 54 |
| 17 | 34 |
| 29 | 34 |
| 31 | 47 |
| 6 | 47 |
| 30 | 42 |
| 27 | 47 |
| 40 | 54 |
| 19 | 54 |
| 8 | 56 |
| 8 | 60 |
| 15 | 44 |
Homework Answers
The data for the variable of interest – Percent Time Asleep, is as follows,
22,9,49,1,23,83,23,15,9,81,12,15,37,24,26,17,14,14,6,25,18,26,24,29,27,18,6,19,7,16,13,35,2,35,6,15,14,18,50,25,10,33,43,35,17,27,22,16,20,37,23,4,20,42,9,32,66,28,10,4,12,17,12,23,40,18,10,38,7,23,36,9,21,62,36,23,62,28,18,10,28,22,29,15,73,10,5,13,27,20,21,12,49,17,22,71,17,10,24,18,34,6,4,22,28,31,16,27,8,32,20,35,12,14,17,29,31,6,30,27,40,19,8,8,15
The histogram for the variable of interest – Percent Time Asleep, is depicted below.
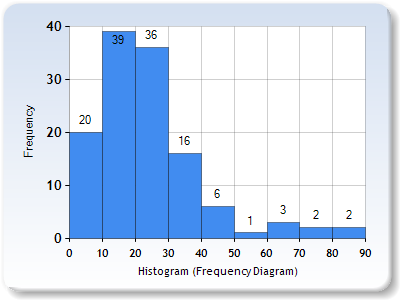
The above histogram is not symmetric. It is skewed to the left. It has two peaks. The first peak is located in the class interval, "10 to 19", and the second peak is located in the class interval, "60 to 69".
The above histogram has no gaps.
The data for the variable of interest – Longevity, is as follows,
35,37,49,46,63,39,46,56,63,65,56,65,70,63,65,70,77,81,86,70,70,77,77,81,77,40,37,44,47,47,47,68,47,54,61,71,75,89,58,59,62,79,96,58,62,70,72,75,96,75,46,42,65,46,58,42,48,58,50,80,63,65,70,70,72,97,46,56,70,70,72,76,90,76,92,21,40,44,54,36,40,56,60,48,53,60,60,65,68,60,81,81,48,48,56,68,75,81,48,68,16,19,19,32,33,33,30,42,42,33,26,30,40,54,34,34,47,47,42,47,54,54,56,60,44
The histogram for the variable of interest – Longevity, is depicted below.

The above histogram is not symmetric. It is skewed to the left. It has one peak. The peak is located in the class interval, "45 to 54".
The above histogram has no gaps.
Add Answer to:
For each variable of interest –
Percent Time Asleep and Longevity – create a grouped frequency...
For the two variables of interest: Create a scatter plot with Percent Time Asleep as the...
For the two variables of interest: Create a scatter plot with Percent Time Asleep as the independent variable x and Longevity as the dependent variable y. The plot must include an informative title, along with correct labels for both axes. Include a plot of the least-squares equation (see #5 below). Calculate the correlation coefficient and the coefficient of determination. Identify any data points on the scatter diagram that appear to be influential. Use Cook's Distance > (4⁄√n) as the criterion...
Conduct a formal hypothesis test of the claim that the mean longevity is less than 57...
Conduct a formal hypothesis test of the claim that the mean longevity is less than 57 days. Test at significance α=0.05. Your written summary of this test must include the following: Your null and alternate hypotheses in the proper format. The type of distribution you used to construct the interval (t or normal). The P-value and its logical relationship to α (≤ or >). Your decision regarding the null hypothesis: reject or fail to reject. A statement regarding the sufficiency/insufficiency...
For each variable of interest, do the following: 1. Find the mean, five-number summary, range, variance,...
For each variable of interest, do the following: 1. Find the mean, five-number summary, range, variance, and standard deviation. Display these numbers in a format that is easy to understand. 2. For each variable of interest, use its five-number summary to construct a boxplot. Each boxplot must be constructed horizontally, and must be accompanied by a brief descriptive paragraph that assesses whether the data appear to be symmetrical, left-skewed, or right-skewed. Construct a 95% confidence interval for the mean μ...
RANGES FREQUENCY RELATIVE FREQUENCY CUMULATIVE REL. FREQ. 1 - 10 11 - 20 21 - 30 31 - 40...
 RANGES
FREQUENCY
RELATIVE FREQUENCY
CUMULATIVE REL. FREQ.
1 - 10
11 - 20
21 - 30
31 - 40
41 - 50
51 - 60
61 - 70
71 - 80
81 - 90
91 - 100
'= 100 DATA
VALUES??
SO, WHAT DOES A FREQUENCY TABLE TELL US?
If
you wrote each of the above data values on a ping pong ball,, put
them in a jar and blindly pulled one out:
What is the probability that this ball...
RANGES
FREQUENCY
RELATIVE FREQUENCY
CUMULATIVE REL. FREQ.
1 - 10
11 - 20
21 - 30
31 - 40
41 - 50
51 - 60
61 - 70
71 - 80
81 - 90
91 - 100
'= 100 DATA
VALUES??
SO, WHAT DOES A FREQUENCY TABLE TELL US?
If
you wrote each of the above data values on a ping pong ball,, put
them in a jar and blindly pulled one out:
What is the probability that this ball...
Consider the below matrixA, which you can copy and paste directly into Matlab.
Problem #1: Consider the below matrix A, which you can copy and paste directly into Matlab. The matrix contains 3 columns. The first column consists of Test #1 marks, the second column is Test # 2 marks, and the third column is final exam marks for a large linear algebra course. Each row represents a particular student.A = [36 45 75 81 59 73 77 73 73 65 72 78 65 55 83 73 57 78 84 31 60 83...
NUMBER OF PEOPLE 10.2 10.0 10.1 8.5 10.2 8.2 8 Source: United States Census. 11. In...
 NUMBER OF PEOPLE 10.2 10.0 10.1 8.5 10.2 8.2 8 Source: United States Census. 11. In the Sanitary District of Chicago, operating engineers are hired on of a competitive civil-service examination. In 1966, there were 223 appl for 15 jobs. The exam was held on March 12; the test scores are s arranged in increasing order. The height of each bar in the histogram next page) shows the number of people with the correspondin examiners were charged with rigging the...
estimate the average age at which multiple sclerosis patients were diagnosed with the condition for the...
estimate the average age at which multiple sclerosis patients were diagnosed with the condition for the first time in a given city. How big should the sample be? Define your procedures for this estimate (if necessary, set your own values of unknown parameters, based on statistical theory). In Table 1 you will find all ages of this patient population. 54 58 56 48 62 59 55 56 60 52 53 61 56 56 53 37 71 62 39 61 54...
Problem 4: Variables that may affect Grades The data set contains a random sample of STAT 250 Final Exam Scores out of 80 points. For each individual sampled, the time (in hours per week) that the stu...
Problem 4: Variables that may affect Grades The data set contains a random sample of STAT 250 Final Exam Scores out of 80 points. For each individual sampled, the time (in hours per week) that the student spent participating in a GMU club or sport and working for pay outside of GMU was recorded. Values of 0 indicate the students either does not participate in a club or sport or does not work a job for pay. The goal of...
(a). Construct a frequency distribution with the suitable class interval size of marks obtained by 50...
(a). Construct a frequency distribution with the suitable class interval size of marks obtained by 50 students of a class, which are given below: 23, 50, 38, 42, 63, 75, 12, 33, 26, 39, 35, 47, 43, 52, 56, 59, 64, 77, 15, 21, 51, 54, 72, 68, 36, 65, 52, 60, 27, 34, 47, 48, 55, 58, 59, 62, 51, 48, 50, 41, 57, 65, 54, 43, 56, 44, 30, 46, 67, 53 (b). Find the Minimum Value (c)....
Calculate the range, mean, mode, median, Standard deviation Calculate the skewness and kurtosis for the above...
Calculate the range, mean, mode, median, Standard deviation Calculate the skewness and kurtosis for the above data and interpret the data. The following is data collected from the daily salary employees of ZZ COMPANY.. 68 19 43 11 37 30 19 67 65 34 96 23 93 73 46 39 21 12 89 52 33 21 18 57 80 56 91 62 56 48 84 23 78 96 49 36 90 42 65 15 43 36 65 59 34 71...
 RANGES
FREQUENCY
RELATIVE FREQUENCY
CUMULATIVE REL. FREQ.
1 - 10
11 - 20
21 - 30
31 - 40
41 - 50
51 - 60
61 - 70
71 - 80
81 - 90
91 - 100
'= 100 DATA
VALUES??
SO, WHAT DOES A FREQUENCY TABLE TELL US?
If
you wrote each of the above data values on a ping pong ball,, put
them in a jar and blindly pulled one out:
What is the probability that this ball...
RANGES
FREQUENCY
RELATIVE FREQUENCY
CUMULATIVE REL. FREQ.
1 - 10
11 - 20
21 - 30
31 - 40
41 - 50
51 - 60
61 - 70
71 - 80
81 - 90
91 - 100
'= 100 DATA
VALUES??
SO, WHAT DOES A FREQUENCY TABLE TELL US?
If
you wrote each of the above data values on a ping pong ball,, put
them in a jar and blindly pulled one out:
What is the probability that this ball...
 NUMBER OF PEOPLE 10.2 10.0 10.1 8.5 10.2 8.2 8 Source: United States Census. 11. In the Sanitary District of Chicago, operating engineers are hired on of a competitive civil-service examination. In 1966, there were 223 appl for 15 jobs. The exam was held on March 12; the test scores are s arranged in increasing order. The height of each bar in the histogram next page) shows the number of people with the correspondin examiners were charged with rigging the...
Most questions answered within 3 hours.
-
##8. A program contains the following function definition:
##def cube(num):
##return num * num * num...
asked 3 minutes ago -
find the value z of a standard Normal variable that satisfies
each of the given conditions....
asked 26 minutes ago -
"banana".find('z')
Out[22]: -1
why is this -1
python 3.7
asked 7 minutes ago -
Ilegal Consideration Marna Balin was involved in two automobile
accidents in which she suffered severe injures.She...
asked 16 minutes ago -
Walk through the operation of QuickSort when n = 7 and the input
array is A...
asked 11 minutes ago -
Answer with True or False. Argue the answers
7) The circulation of field B on any...
asked 19 minutes ago -
Chase Co. uses the perpetual inventory method. The inventory
records for Chase reflected the following
Jan...
asked 17 minutes ago -
what are is the correct compression for these two ipv6 ips.. i
keep getting them wrong...
asked 22 minutes ago -
How does the amount of silica gel used change separation?
asked 23 minutes ago -
A barium hydroxide solution is prepared by dissolving 1.91 g1.91
g of Ba(OH)2Ba(OH)2 in water to...
asked 42 minutes ago -
barium oxide with water Express your answer as a chemical
equation. Identify all of the phases...
asked 46 minutes ago -
In the laboratory a "coffee cup"
calorimeter, or constant pressure calorimeter, is
frequently used to determine...
asked 44 minutes ago