please help with both, thank you very much!
Homework Answers
Solution-1:
Ho:sigma=29
Ha:sigma<29
For the given sample ,n=9
sample standard deviation=7.53326
F=(n-1)*s^2/sigma^2
=(9-1)* 7.53326^2/29^2
=0.5398336
chi sq critcal value
=CHISQ.INV(0.05,8)
=2.732636793
answer:
test statistic is less than the critical value.Therefore,we cannot say that supermodel's weights are less variable than the general popualtion
OPTION C
Solution-2:
Ho:indpendent
Ha:dependent
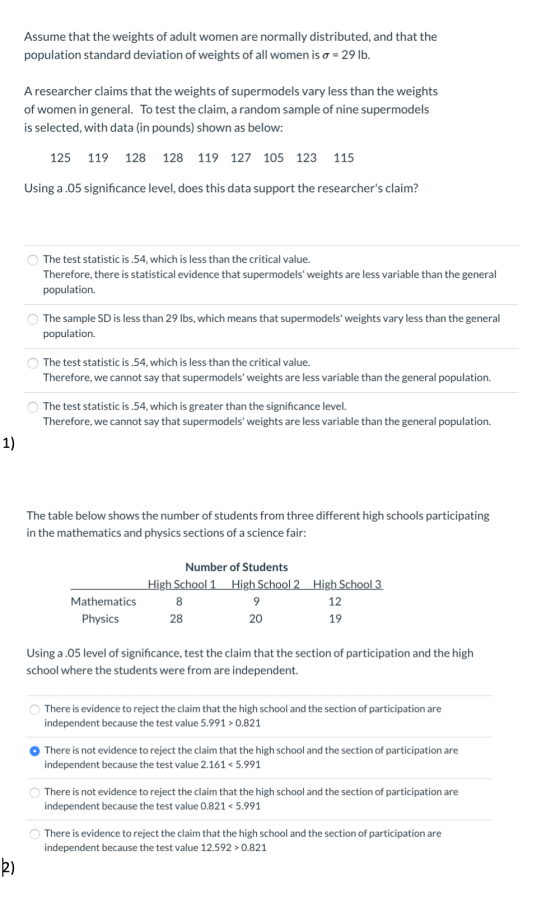
![TEXAS INSTRUMENTS TI-83 Plus X2-Test X2=2.161115713 P=.3394061329 df=2 MATRIX[A] 2 X3 [B 9 12 [ 28 20 19 2, 3=19 FORMAT 3 CAL](http://img.homeworklib.com/questions/ce75ec60-f803-11ea-8987-43680f54b4ef.png?x-oss-process=image/resize,w_560)
chi sq=2.161
chi sq critical vale
=CHISQ.INV.RT(0.05,2)
=5.991464547
p=0.3394
ANSWER:
There is not evidence to reject the claim that the high school and section of participants are independent because
the test value 2.161<5.991
OPTION B
Add Answer to:
please help with both, thank you very much!
Assume that the weights of adult women are...
The table below shows the number of students from three different high schools participating in the...
The table below shows the number of students from three different high schools participating in the mathematics and physics sections of a science fair: Number of Students High School 1 High School 2 High School 3 Mathematics 8 9 12 Physics 28 20 19 Using a .05 level of significance, test the claim that the section of participation and the high school where the students were from are independent. Group of answer choices There is evidence to reject the claim...
PLEASE HELP ME OUT WITH BOTH QUESTIONS!!! it is greatly appreciated!! thank you so much. no need to show the work. You w...
 PLEASE
HELP ME OUT WITH BOTH QUESTIONS!!!
it is greatly appreciated!! thank you so much. no need to show
the work.
You wish to test the claim that the average IQ score is less than 100 at the .005 significance level. You determine the hypotheses are: Ho:u= 100 H1:4 < 100 You take a simple random sample of 72 individuals and find the mean IQ score is 96.7, with a standard deviation of 15.5. Let's consider testing this hypothesis two...
PLEASE
HELP ME OUT WITH BOTH QUESTIONS!!!
it is greatly appreciated!! thank you so much. no need to show
the work.
You wish to test the claim that the average IQ score is less than 100 at the .005 significance level. You determine the hypotheses are: Ho:u= 100 H1:4 < 100 You take a simple random sample of 72 individuals and find the mean IQ score is 96.7, with a standard deviation of 15.5. Let's consider testing this hypothesis two...
1. Labor statistics indicate that 77% of all U.S. cashiers and servers are women. A random...
1. Labor statistics indicate that 77% of all U.S. cashiers and servers are women. A random sample of cashiers and servers in a particular metropolitan area found that 112 of 150 cashiers and 150 of 200 servers were women. At the 0.05 level of significance, is there sufficient evidence to conclude that a difference exists between this metropolitan area and the larger U.S. population? a) What is the test statistic? Round to 2 decimal places. b) What is the p-value?...
The table below gives results from random samples of weights (in pounds) of men and women....
 The table below gives results from random samples of weights (in pounds) of men and women. Pop Gender 1 Men 2 Women n s 40 8.7 33 10.6 At a 0.05, test the claim that weights of men are more consistent than weights of women. 1. The alternate hypothesis is Ha: Osı > S2 O si <S2 Οσι < σ2 Oo > 02 2. This is a left tailed test with: df and dfa 3a. The STS (to 2 decimals)...
Data on the weights (lb) of the contents of cans of diet soda versus the contents of cans of the regular version of the soda is summarized to the right. Assume that the two samples are independent si...
 Data on the weights (lb) of the contents of cans of diet soda versus the contents of cans of the regular version of the soda is summarized to the right. Assume that the two samples are independent simple random samples selected from normally distributed populations, and do not assume that the population standard deviations are equal Complete parts (a) and (b) below. Use a 0.01 significance level for both parts. Diet Reqular μ2 26 0.81485 Ib 0.00755 lb 26 0.78439...
Sleep: Assume the general population gets an average of 7 hours of sleep per night. You...
Sleep: Assume the general population gets an average of 7 hours of sleep per night. You randomly select 45 college students and survey them on their sleep habits. From this sample, the mean number of hours of sleep is found to be 6.89 hours with a standard deviation of 0.40 hours. You claim that college students get less sleep than the general population. That is, you claim the mean number of hours of sleep for all college students is less...
please help and explain steps, thank you very much! The engineering school at a major university...
 please help and explain steps, thank you
very much!
The engineering school at a major university claims that more than 20% of its graduates are women. In a graduating class of 210 students, 58 were women. Does this data provide evidence to support the school's claim at the a = 0.05 significance level?
please help and explain steps, thank you
very much!
The engineering school at a major university claims that more than 20% of its graduates are women. In a graduating class of 210 students, 58 were women. Does this data provide evidence to support the school's claim at the a = 0.05 significance level?
You are conducting a study to see if the proportion of women over 40 who regularly...
 You are conducting a study to see if the proportion of women over 40 who regularly have mammograms is significantly more than 0.68. You use a significance level of a = 0.002. Ho:p=0.68 H:p > 0.68 You obtain a sample of size n = 359 in which there are 253 successes. What is the test statistic for this sample? (Report answer accurate to three decimal places.) test statistic - What is the p-value for this sample? (Report answer accurate to...
It is known that the mean of height of the population of women is 65 inches....
It is known that the mean of height of the population of women is 65 inches. A random sample of 18 supermodels was selected, and they had a mean height of 69.9 inches and a standard deviation of 1.2 inches. Use a 0.05 significance level to test the claim that mean heights of female supermodels are larger than the mean heights of women in general. a.) Write the claim using an appropriate math expression b.) Define the Null and Alternate...
The health of employees is monitored by periodically weighing them in. A sample of n =...
The health of employees is monitored by periodically weighing them in. A sample of n = 54 employees has a mean weight of x̄ = 190 lb. Assuming that σ = 25 lb, use a 0.01 significance level to test the claim that the population mean of all such employees weights is less than 200 lb. Group of answer choices a. H0: μ = 200; H1: μ < 200; Test statistic: z = -2.94. P-value: 0.0016. Since the P-Value is...
 PLEASE
HELP ME OUT WITH BOTH QUESTIONS!!!
it is greatly appreciated!! thank you so much. no need to show
the work.
You wish to test the claim that the average IQ score is less than 100 at the .005 significance level. You determine the hypotheses are: Ho:u= 100 H1:4 < 100 You take a simple random sample of 72 individuals and find the mean IQ score is 96.7, with a standard deviation of 15.5. Let's consider testing this hypothesis two...
PLEASE
HELP ME OUT WITH BOTH QUESTIONS!!!
it is greatly appreciated!! thank you so much. no need to show
the work.
You wish to test the claim that the average IQ score is less than 100 at the .005 significance level. You determine the hypotheses are: Ho:u= 100 H1:4 < 100 You take a simple random sample of 72 individuals and find the mean IQ score is 96.7, with a standard deviation of 15.5. Let's consider testing this hypothesis two...
 The table below gives results from random samples of weights (in pounds) of men and women. Pop Gender 1 Men 2 Women n s 40 8.7 33 10.6 At a 0.05, test the claim that weights of men are more consistent than weights of women. 1. The alternate hypothesis is Ha: Osı > S2 O si <S2 Οσι < σ2 Oo > 02 2. This is a left tailed test with: df and dfa 3a. The STS (to 2 decimals)...
 Data on the weights (lb) of the contents of cans of diet soda versus the contents of cans of the regular version of the soda is summarized to the right. Assume that the two samples are independent simple random samples selected from normally distributed populations, and do not assume that the population standard deviations are equal Complete parts (a) and (b) below. Use a 0.01 significance level for both parts. Diet Reqular μ2 26 0.81485 Ib 0.00755 lb 26 0.78439...
 please help and explain steps, thank you
very much!
The engineering school at a major university claims that more than 20% of its graduates are women. In a graduating class of 210 students, 58 were women. Does this data provide evidence to support the school's claim at the a = 0.05 significance level?
please help and explain steps, thank you
very much!
The engineering school at a major university claims that more than 20% of its graduates are women. In a graduating class of 210 students, 58 were women. Does this data provide evidence to support the school's claim at the a = 0.05 significance level?
 You are conducting a study to see if the proportion of women over 40 who regularly have mammograms is significantly more than 0.68. You use a significance level of a = 0.002. Ho:p=0.68 H:p > 0.68 You obtain a sample of size n = 359 in which there are 253 successes. What is the test statistic for this sample? (Report answer accurate to three decimal places.) test statistic - What is the p-value for this sample? (Report answer accurate to...
Most questions answered within 3 hours.
-
QUESTION 5
A drug or medicine can reach the brain more effectively by
placing the drug...
asked 40 seconds ago -
Rammazzotti, Inc., is looking for feedback on company
performance. The company compares the budget for the...
asked 1 minute ago -
A manufacturer of chocolate chips would like to know whether its
bag filling machine works correctly...
asked 10 minutes ago -
Consider the student registration business process at
your college:
1.)Describe the steps necessary for you to...
asked 17 minutes ago -
when released from rest at point A, an unknown ion moves to
point B. At point...
asked 9 minutes ago -
A stock is expected to pay the following dividends: $1.1
four years from now, $1.4 five...
asked 14 minutes ago -
G=yellow and g=green pea seeds. You cross a heterozygous
yellow-seeded plant with a green-seeded plant to...
asked 17 minutes ago -
Current Balance Experiment
a) When there is no current flowing through the electromagnet
coil, is there...
asked 16 minutes ago -
In Visual Basic 2017, Write a complete Main method that prints
Hello, world to the screen....
asked 32 minutes ago -
a) Find the pressure difference on an airplane wing if air flows
over the upper surface...
asked 38 minutes ago -
Write an assessment of the current business analysis of Hilton
Worldwide using Porters 5 Forces analysis.
asked 49 minutes ago -
i need help on this
Chapter 9 Section 3 Question 1:
Rudy puts this poster, with...
asked 57 minutes ago