
Homework Answers
1. correlation coefficient is calculated using the formula
![{\color{Red} r=\frac{average(xy)-average(x)*average(y)}{\sqrt{[average(x^2)-(average(x))^{2}]*[average(y^2)-(average(y))^{2}]}}}](http://img.homeworklib.com/questions/b339a620-f957-11ea-8f36-cd624fc86abe.png?x-oss-process=image/resize,w_560)
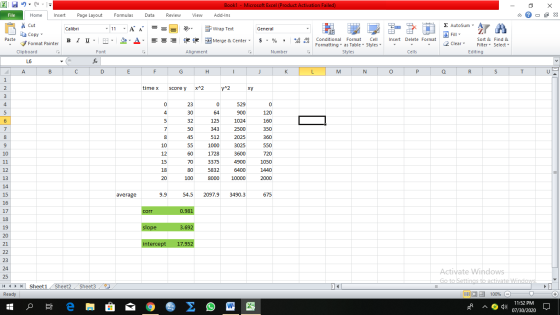
Substituting the values, we get r = 0.981
Using the method of least squares, the estimated regression line is given by
Y=b0+b1X, where b0 is the intercept and b1 is the slope estimate.
and 
and 
Substituting the values, we get ,
2. Slope = b1 = 3.692 and
3. Intercept = b0 = 17.952
4. The sample regression line is given by Y=17.952+3.692X
5. When X=14, Y =17.952+3.692*14 = 69.64
6. when X= 15, Y =17.952+3.692*15 =73.33
7.The observed score forX=15 is 70, thus the difference is y-Y, ie, 70-73.33= -3.33
This is a very long question. Please give the remaining parts as another question
thank you :)
Add Answer to:
Please provide excel formulas Stat 3309 - Statistical Analysis for Business Applications I Consider the following...
Please answer all the questions relating to part 1 Stat 3309 - Statistical Analysis for Business...
 Please answer all the questions relating to part 1
Stat 3309 - Statistical Analysis for Business Applications I Consider the following data representing the starting salary in $1,000) at some company and years of prior working experience in the same field. The sample of 10 employees was taken and the following data is reported. years of experience starting salary in $1,000) 2 50 15 18 20 Part 1: Use the formulas provided on the 3rd formula sheet to compute the...
Please answer all the questions relating to part 1
Stat 3309 - Statistical Analysis for Business Applications I Consider the following data representing the starting salary in $1,000) at some company and years of prior working experience in the same field. The sample of 10 employees was taken and the following data is reported. years of experience starting salary in $1,000) 2 50 15 18 20 Part 1: Use the formulas provided on the 3rd formula sheet to compute the...
Name Economics 5 Ch 13 Practice The follo wing data are the monthly salaries y and the grade point averages x for students who obtained a bachelor's degree in business administ ration Obser vatio...
 Name Economics 5 Ch 13 Practice The follo wing data are the monthly salaries y and the grade point averages x for students who obtained a bachelor's degree in business administ ration Obser vation index xi 2.6 3300 3.4 3600 3.6 4000 3.2 3500 3.5 3900 2.9 3600 TSS Totals SSR SSE 1. Calculate and y 2. Use the least squares method to develop the estimated regression equation. Use two decimal points in your answers for bo and bi. 3....
1. In regression analysis, the Sum of Squares Total (SST) is a. The total variation of...
1. In regression analysis, the Sum of Squares Total (SST) is a. The total variation of the dependent variable b. The total variation of the independent variable c. The variation of the dependent variable that is explained by the regression line d. The variation of the dependent variable that is unexplained by the regression line Question 2 In regression analysis, the Sum of Squares Regression (SSR) is A. The total variation of the dependent variable B. The total variation of the independent variable...
What is the relationship between the amount of time statistics students study per week and their...
 What is the relationship between the amount of time statistics students study per week and their final exam scores? The results of the survey are shown below. Time Score 3 10 15 512 015 58 75 89 89 77 79 54 96 a. Find the correlation coefficient: r = Round to 2 decimal places. b. The null and alternative hypotheses for correlation are: Ho: ? - 0 H: 70 (Round to four The p-value is: decimal places) c. Use a...
please correct red error boxes What is the relationship between the amount of time statistics students...
 please correct red error boxes
What is the relationship between the amount of time statistics students study per week and their final exam scores! The results of the survey are shown below The ruil and alternative hypotheses for correlation are The preluet: 1.0024 Round to four decimal places c. Use a level of sigrice -0.05 to state the conclusion of the hypothesis test in the context of There la statistically significant evidence la conclude that there a carrodation between the...
please correct red error boxes
What is the relationship between the amount of time statistics students study per week and their final exam scores! The results of the survey are shown below The ruil and alternative hypotheses for correlation are The preluet: 1.0024 Round to four decimal places c. Use a level of sigrice -0.05 to state the conclusion of the hypothesis test in the context of There la statistically significant evidence la conclude that there a carrodation between the...
What is the relationship between the amount of time statistics students study per week and their...
 What is the relationship between the amount of time statistics students study per week and their final exam scores? The results of the survey are shown below. Time Score 3 67 13 95 6 15 77 89 13 100 3 66 7 63 11 79 1 59 a. Find the correlation coefficient: r = Round to 2 decimal places. b. The null and alternative hypotheses for correlation are: Ho: ? D = 0 H: ? *0 The p-value is: (Round...
Please answer all fill in the blanks, thanks! In the United States, tire tread depth is...
 Please answer all fill in the blanks, thanks!
In the United States, tire tread depth is measured in 32nds of an inch. Car tires typically start out with 10/32 to 11/32 of an inch of tread depth. In most states, a tire is legally worn out when its tread depth reaches 2/32 of an inch. A random sample of four tires provides the following data on mileage and tread depth: Mileage (10,000 miles) Tread Depth (32nds of an inch) Tire...
Please answer all fill in the blanks, thanks!
In the United States, tire tread depth is measured in 32nds of an inch. Car tires typically start out with 10/32 to 11/32 of an inch of tread depth. In most states, a tire is legally worn out when its tread depth reaches 2/32 of an inch. A random sample of four tires provides the following data on mileage and tread depth: Mileage (10,000 miles) Tread Depth (32nds of an inch) Tire...
What is the relationship between the amount of time statistics students study per week and their...
What is the relationship between the amount of time statistics students study per week and their final exam scores? The results of the survey are shown below. Time 12 0 3 14 14 9 0 13 10 Score 95 60 73 85 86 89 65 97 93 Find the correlation coefficient: r=r= Round to 2 decimal places. The null and alternative hypotheses for correlation are: H0:H0: ? μ ρ r == 0 H1:H1: ? ρ μ r ≠≠ 0 The p-value is: (Round...
Please help me out by giving me detailed answers with formulas. So I can understand fully...
Please help me out by giving me detailed answers with formulas. So I can understand fully Thank you very much A study is conducted to examine the influence of ‘screen time’ on student performance on Statistics exams. A class of 12 students is observed over a period of time, with the independent variable being the average amount of time per day each student spends on TV/internet, and the dependent variable being their subsequent Statistics exam score, in %. The data...
A statistics teacher collected the following data to determine if the number of hours a student...
A statistics teacher collected the following data to determine if the number of hours a student studied during the semester could be used to predict the final grade for the course. The default level of significance is .05 in excel. Use the default level of significance. Student Hours Studying Final Grade 1 42 92 2 58 95 3 32 81 4 39 78 5 37 75 6 51 88 7 49 85 8 45 85 1. State your dependent and...
 Please answer all the questions relating to part 1
Stat 3309 - Statistical Analysis for Business Applications I Consider the following data representing the starting salary in $1,000) at some company and years of prior working experience in the same field. The sample of 10 employees was taken and the following data is reported. years of experience starting salary in $1,000) 2 50 15 18 20 Part 1: Use the formulas provided on the 3rd formula sheet to compute the...
Please answer all the questions relating to part 1
Stat 3309 - Statistical Analysis for Business Applications I Consider the following data representing the starting salary in $1,000) at some company and years of prior working experience in the same field. The sample of 10 employees was taken and the following data is reported. years of experience starting salary in $1,000) 2 50 15 18 20 Part 1: Use the formulas provided on the 3rd formula sheet to compute the...
 Name Economics 5 Ch 13 Practice The follo wing data are the monthly salaries y and the grade point averages x for students who obtained a bachelor's degree in business administ ration Obser vation index xi 2.6 3300 3.4 3600 3.6 4000 3.2 3500 3.5 3900 2.9 3600 TSS Totals SSR SSE 1. Calculate and y 2. Use the least squares method to develop the estimated regression equation. Use two decimal points in your answers for bo and bi. 3....
 What is the relationship between the amount of time statistics students study per week and their final exam scores? The results of the survey are shown below. Time Score 3 10 15 512 015 58 75 89 89 77 79 54 96 a. Find the correlation coefficient: r = Round to 2 decimal places. b. The null and alternative hypotheses for correlation are: Ho: ? - 0 H: 70 (Round to four The p-value is: decimal places) c. Use a...
 please correct red error boxes
What is the relationship between the amount of time statistics students study per week and their final exam scores! The results of the survey are shown below The ruil and alternative hypotheses for correlation are The preluet: 1.0024 Round to four decimal places c. Use a level of sigrice -0.05 to state the conclusion of the hypothesis test in the context of There la statistically significant evidence la conclude that there a carrodation between the...
please correct red error boxes
What is the relationship between the amount of time statistics students study per week and their final exam scores! The results of the survey are shown below The ruil and alternative hypotheses for correlation are The preluet: 1.0024 Round to four decimal places c. Use a level of sigrice -0.05 to state the conclusion of the hypothesis test in the context of There la statistically significant evidence la conclude that there a carrodation between the...
 What is the relationship between the amount of time statistics students study per week and their final exam scores? The results of the survey are shown below. Time Score 3 67 13 95 6 15 77 89 13 100 3 66 7 63 11 79 1 59 a. Find the correlation coefficient: r = Round to 2 decimal places. b. The null and alternative hypotheses for correlation are: Ho: ? D = 0 H: ? *0 The p-value is: (Round...
 Please answer all fill in the blanks, thanks!
In the United States, tire tread depth is measured in 32nds of an inch. Car tires typically start out with 10/32 to 11/32 of an inch of tread depth. In most states, a tire is legally worn out when its tread depth reaches 2/32 of an inch. A random sample of four tires provides the following data on mileage and tread depth: Mileage (10,000 miles) Tread Depth (32nds of an inch) Tire...
Please answer all fill in the blanks, thanks!
In the United States, tire tread depth is measured in 32nds of an inch. Car tires typically start out with 10/32 to 11/32 of an inch of tread depth. In most states, a tire is legally worn out when its tread depth reaches 2/32 of an inch. A random sample of four tires provides the following data on mileage and tread depth: Mileage (10,000 miles) Tread Depth (32nds of an inch) Tire...
Most questions answered within 3 hours.
-
Considering gravitational time dilation, calculate the time that
passes in Earth’s surface while 1 hour passes...
asked 5 minutes ago -
Minitab Problem: Take the Lake Hume June rainfall data and find
use the processes outlined in...
asked 57 minutes ago -
X Company is trying to decide whether to continue using old
equipment to make Product A...
asked 58 minutes ago -
IN PYTHON ONLY !! Program 2: Re-work
program #5 (WeeklyHours) from the previous assignment such that...
asked 1 hour ago -
The average length of time between arrivals at a turnpike
toll-booth is 26 seconds. What is...
asked 3 hours ago -
(a) A piston at 6.1 atm contains a gas that occupies a volume of
3.5 L....
asked 4 hours ago -
Please answer true or false. Words
cannot be changed or added in to make it true...
asked 4 hours ago -
An empty test tube weighs 15.923 grams. Then,
MgCl2•6H2O is added into the test tube. After...
asked 4 hours ago -
Assume memory access is 10 units of time and disk access is
10000 units of time....
asked 4 hours ago -
1. Are all good samples random?
2. Magazines often report surveys giving statistics such as “63%...
asked 5 hours ago -
Under all the various types of market structures, firms
must eventually earn some economic profits for...
asked 4 hours ago -
Consider the following fitness regime for a single locus trait
with two co-dominant alleles: w11 =...
asked 4 hours ago