Please help me out by giving me detailed answers with formulas. So I can understand fully...
Please help me out by giving me detailed answers with formulas. So I can understand fully
Thank you very much
A study is conducted to examine the influence of ‘screen time’ on student performance on Statistics exams. A class of 12 students is observed over a period of time, with the independent variable being the average amount of time per day each student spends on TV/internet, and the dependent variable being their subsequent Statistics exam score, in %. The data is shown in the table below:
|
Student |
Hrs/Day Watching TV or on Internet |
Exam Score (%) |
|
1 |
0 |
100 |
|
2 |
4.6 |
79 |
|
3 |
2.5 |
65 |
|
4 |
7.2 |
26 |
|
5 |
3.0 |
41 |
|
6 |
3.9 |
94 |
|
7 |
4.2 |
94 |
|
8 |
3.9 |
52 |
|
9 |
8.6 |
13 |
|
10 |
3.9 |
84 |
|
11 |
2.8 |
66 |
|
12 |
4.0 |
61 |
(a) Determine the equation of the line of best fit, relating Y = exam score (%) to X = hrs/day spent watching TV or on the internet.
(b) Use the line of best fit calculated in Part (a) to calculate an estimate for the exam score that a student would get, to the nearest %, if they spent an average of 2.5 hrs/day watching TV or on the internet. Repeat for an estimate of the exam score that would result after a student spent an average of 5.0 hrs/day watching TV or on the internet.
(c) Plot the raw data from the table on an x-y graph, and then draw the line of best fit showing at least 2 calculated points that are on that line (Hint: your answers for Parts (a) and (b) provide you with 4 such points).
(d) What is the predicted exam score, to the nearest %, for a student who completely avoids the TV or internet? Repeat for a predicted exam score for a student who spends an average of 12.0 hrs/day watching TV or on the internet. Comment briefly on your answers for these two estimates, and what it implies about the limitations of the linear regression model generated in Part (a).
(e) Calculate the covariance between X and Y.
(f) Calculate the correlation coefficient for this data set.
(g) Calculate the coefficient of determination for this data set, and explain what its value means with respect to the line of best fit calculated in Part (a).
(h) Conduct a hypothesis test on the significance of correlation between hrs/day spent watching TV or on the internet, and exam performance, using the critical-value method at LOC = 95%.
(i) Use the p-value method to determine the common values of LOC (if any) for which your decision in Part (h) would be that there is no significant correlation between X and Y, and the common LOC values (if any) for which the opposite decision would be made.
Homework Answers
| X | Y | XY | X² | Y² |
| 0 | 100 | 0 | 0 | 10000 |
| 4.6 | 79 | 363.4 | 21.16 | 6241 |
| 2.5 | 65 | 162.5 | 6.25 | 4225 |
| 7.2 | 26 | 187.2 | 51.84 | 676 |
| 3 | 41 | 123 | 9 | 1681 |
| 3.9 | 94 | 366.6 | 15.21 | 8836 |
| 4.2 | 94 | 394.8 | 17.64 | 8836 |
| 3.9 | 52 | 202.8 | 15.21 | 2704 |
| 8.6 | 13 | 111.8 | 73.96 | 169 |
| 3.9 | 84 | 327.6 | 15.21 | 7056 |
| 2.8 | 66 | 184.8 | 7.84 | 4356 |
| 4 | 61 | 244 | 16 | 3721 |
| Ʃx = | Ʃy = | Ʃxy = | Ʃx² = | Ʃy² = |
| 48.6 | 775 | 2668.5 | 249.32 | 58501 |
| Sample size, n = | 12 |
| x̅ = Ʃx/n = 48.6/12 = | 4.05 |
| y̅ = Ʃy/n = 775/12 = | 64.5833333 |
| SSxx = Ʃx² - (Ʃx)²/n = 249.32 - (48.6)²/12 = | 52.49 |
| SSyy = Ʃy² - (Ʃy)²/n = 58501 - (775)²/12 = | 8448.91667 |
| SSxy = Ʃxy - (Ʃx)(Ʃy)/n = 2668.5 - (48.6)(775)/12 = | -470.25 |
(a)
Slope, b = SSxy/SSxx = -470.25/52.49 = -8.958849
y-intercept, a = y̅ -b* x̅ = 64.58333 - (-8.95885)*4.05 = 100.86667
Regression equation :
ŷ = 100.8667 + (-8.9588) x
(b)
Predicted value of y at x = 2.5
ŷ = 100.8667 + (-8.9588) * 2.5 = 78.4695
Predicted value of y at x = 5
ŷ = 100.8667 + (-8.9588) * 5 = 56.0724
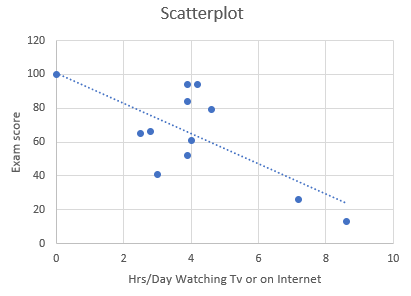
(c) Scatter plot:
(d)
Predicted value of y at x = 0
ŷ = 100.8667 + (-8.9588) * 0 = 100.8667
Predicted value of y at x = 12
ŷ = 100.8667 + (-8.9588) * 12 = -6.6395
(e)
Covariance between X and Y. = SSxy/(n-1) = -470.25/11 = -42.75
(f)
Correlation coefficient, r = SSxy/√(SSxx*SSyy) = -470.25/√(52.49*8448.91667) = -0.7061
(g)
Coefficient of determination, r² = (SSxy)²/(SSxx*SSyy) = (-470.25)²/(52.49*8448.91667) = 0.4986
49.86% variation in y is due to the linear relationship between y and x variables.
(h)
Null and alternative hypothesis:
Ho: ρ = 0 ; Ha: ρ ≠ 0
α = 0.05
Correlation, r = -0.7061
Test statistic :
t = r*√(n-2)/√(1-r²) = -0.7061 *√(12 - 2)/√(1 - -0.7061²) = -3.1536
df = n-2 = 10
Critical value, t_c = T.INV.2T(0.05, 10) = 2.2281
Conclusion:
p-value < α Reject the null hypothesis. There is a correlation between x and y.
(i)
if p-value > 0.05, then there is no significant correlation between X and Y
Add Answer to:
Please help me out by giving me detailed answers with formulas.
So I can understand fully...
Please answer the following questions using the formula for a and b, thank you! Question 1:...
 Please answer the following questions using the formula for a
and b, thank you!
Question 1: A study is conducted to examine the influence of screen time on student performance on Satis exams A class of 12 students is observed over a period of time, with the independenta le being the we amount of time per day each student spends on TV internet, and the dependent able being their subsequent Statistics eum score, in The data is shown in the...
Please answer the following questions using the formula for a
and b, thank you!
Question 1: A study is conducted to examine the influence of screen time on student performance on Satis exams A class of 12 students is observed over a period of time, with the independenta le being the we amount of time per day each student spends on TV internet, and the dependent able being their subsequent Statistics eum score, in The data is shown in the...
What is the relationship between the amount of time statistics students study per week and their...
 What is the relationship between the amount of time statistics students study per week and their final exam scores? The results of the survey are shown below. Time Score 3 67 13 95 6 15 77 89 13 100 3 66 7 63 11 79 1 59 a. Find the correlation coefficient: r = Round to 2 decimal places. b. The null and alternative hypotheses for correlation are: Ho: ? D = 0 H: ? *0 The p-value is: (Round...
Please provide excel formulas Stat 3309 - Statistical Analysis for Business Applications I Consider the following...
 Please provide excel formulas Stat 3309 - Statistical Analysis for Business Applications I Consider the following data representing the total time in hours) a student spent on reviewing for the Stat 3309 final exam and the actual score on the final. The sample of 10 students was taken from a class and the following answers were reported. time score 0 23 4 30 5 32 7 50 8 45 10 55 12 60 15 70 18 80 20 100 Part...
What is the relationship between the amount of time statistics students study per week and their...
What is the relationship between the amount of time statistics students study per week and their final exam scores? The results of the survey are shown below. Time 12 0 3 14 14 9 0 13 10 Score 95 60 73 85 86 89 65 97 93 Find the correlation coefficient: r=r= Round to 2 decimal places. The null and alternative hypotheses for correlation are: H0:H0: ? μ ρ r == 0 H1:H1: ? ρ μ r ≠≠ 0 The p-value is: (Round...
PLEASE COMPLETE THE FOLLOWING FIVE STEPS OF ANOVA AND FILL IN THE BLANKS. THANKS IN ADVANCE...
 PLEASE COMPLETE THE FOLLOWING FIVE STEPS OF ANOVA AND FILL IN
THE BLANKS. THANKS IN ADVANCE
3. Five steps of ANOVA Suppose you are interested in how a person's marital status is related to his or her leisure activities. You randomly sample 21 adults and determine the number of hours each person spends per day watching TV or using the Internet for nonwork activities. The data are shown in the following table: Divorced Single Married 5 2 5 mm Nm...
PLEASE COMPLETE THE FOLLOWING FIVE STEPS OF ANOVA AND FILL IN
THE BLANKS. THANKS IN ADVANCE
3. Five steps of ANOVA Suppose you are interested in how a person's marital status is related to his or her leisure activities. You randomly sample 21 adults and determine the number of hours each person spends per day watching TV or using the Internet for nonwork activities. The data are shown in the following table: Divorced Single Married 5 2 5 mm Nm...
What is the relationship between the amount of time statistics students study per week and their...
What is the relationship between the amount of time statistics students study per week and their test scores? The results of the survey are shown below. Time 13 10 9 9 2 10 12 8 Score 84 83 90 76 74 86 99 85 x-values y-values Find the correlation coefficient: r=r= Round to 2 decimal places. The null and alternative hypotheses for correlation are: H0:H0: ? r ρ μ == 0 H1:H1: ? μ ρ r ≠≠ 0 The p-value is: (Round to...
Find the value of the linear correlation coefficient A study was conducted to compare the average...
 Find the value of the linear correlation coefficient A study was conducted to compare the average time spent in the lab each week versus course grade 7) for computer programming students. The results are recorded in the table below. 51 16 15 16 10 81 51 C) 0.462 A) 0017 B)-0.284 D) -0.335 8) Managers rate employees according to job performance and attitude. The results for several randomly selected employees are given below iertonnance 59 |의 65169 ↓ 5 7...
i neeed help for my qz2 this one is visual basic , i dont understand how...
 i neeed help for my qz2
this one is visual basic , i dont understand how to write
code
QZ2: Linear Regression (100 points) Given: A data table (see next page) Find: 1. Use one-dimensional array to find the equation of least-squares-fit line (slope and y-intercept; 10 points each), correlation coefficient and coefficient of the determination (10 points each) 2. Use two-dimensional array to find the equation of least-squares-fit line (slope and y-intercept; 10 points each), correlation coefficient and coefficient...
i neeed help for my qz2
this one is visual basic , i dont understand how to write
code
QZ2: Linear Regression (100 points) Given: A data table (see next page) Find: 1. Use one-dimensional array to find the equation of least-squares-fit line (slope and y-intercept; 10 points each), correlation coefficient and coefficient of the determination (10 points each) 2. Use two-dimensional array to find the equation of least-squares-fit line (slope and y-intercept; 10 points each), correlation coefficient and coefficient...
What is the relationship between the amount of time statistics students study per week and their...
What is the relationship between the amount of time statistics students study per week and their test scores? The results of the survey are shown below. Time 16 14 15 6 14 15 6 Score 100 89 100 68 99 100 78 x-values y-values Find the correlation coefficient: r=r= Round to 2 decimal places. The null and alternative hypotheses for correlation are: H0:H0: ? ρ r μ == 0 H1:H1: ? μ r ρ ≠≠ 0 The p-value is: (Round to four decimal...
Question 1 Which of the following choices best describes the scatterplot shown below? Group of answer...
Question 1 Which of the following choices best describes the scatterplot shown below? Group of answer choices Linear, negative, strong No form, weak Linear, positive, strong Curved, weak Question 2 Which of the following choices is most likely to be the correlation of the data in the scatterplot shown below? Group of answer choices -0.14 1.04 0.86 -0.92 Question 3 Most roller coasters get their speed by dropping down a steep initial incline, so it makes sense that we can...
 Please answer the following questions using the formula for a
and b, thank you!
Question 1: A study is conducted to examine the influence of screen time on student performance on Satis exams A class of 12 students is observed over a period of time, with the independenta le being the we amount of time per day each student spends on TV internet, and the dependent able being their subsequent Statistics eum score, in The data is shown in the...
Please answer the following questions using the formula for a
and b, thank you!
Question 1: A study is conducted to examine the influence of screen time on student performance on Satis exams A class of 12 students is observed over a period of time, with the independenta le being the we amount of time per day each student spends on TV internet, and the dependent able being their subsequent Statistics eum score, in The data is shown in the...
 What is the relationship between the amount of time statistics students study per week and their final exam scores? The results of the survey are shown below. Time Score 3 67 13 95 6 15 77 89 13 100 3 66 7 63 11 79 1 59 a. Find the correlation coefficient: r = Round to 2 decimal places. b. The null and alternative hypotheses for correlation are: Ho: ? D = 0 H: ? *0 The p-value is: (Round...
 Please provide excel formulas Stat 3309 - Statistical Analysis for Business Applications I Consider the following data representing the total time in hours) a student spent on reviewing for the Stat 3309 final exam and the actual score on the final. The sample of 10 students was taken from a class and the following answers were reported. time score 0 23 4 30 5 32 7 50 8 45 10 55 12 60 15 70 18 80 20 100 Part...
 PLEASE COMPLETE THE FOLLOWING FIVE STEPS OF ANOVA AND FILL IN
THE BLANKS. THANKS IN ADVANCE
3. Five steps of ANOVA Suppose you are interested in how a person's marital status is related to his or her leisure activities. You randomly sample 21 adults and determine the number of hours each person spends per day watching TV or using the Internet for nonwork activities. The data are shown in the following table: Divorced Single Married 5 2 5 mm Nm...
PLEASE COMPLETE THE FOLLOWING FIVE STEPS OF ANOVA AND FILL IN
THE BLANKS. THANKS IN ADVANCE
3. Five steps of ANOVA Suppose you are interested in how a person's marital status is related to his or her leisure activities. You randomly sample 21 adults and determine the number of hours each person spends per day watching TV or using the Internet for nonwork activities. The data are shown in the following table: Divorced Single Married 5 2 5 mm Nm...
 Find the value of the linear correlation coefficient A study was conducted to compare the average time spent in the lab each week versus course grade 7) for computer programming students. The results are recorded in the table below. 51 16 15 16 10 81 51 C) 0.462 A) 0017 B)-0.284 D) -0.335 8) Managers rate employees according to job performance and attitude. The results for several randomly selected employees are given below iertonnance 59 |의 65169 ↓ 5 7...
 i neeed help for my qz2
this one is visual basic , i dont understand how to write
code
QZ2: Linear Regression (100 points) Given: A data table (see next page) Find: 1. Use one-dimensional array to find the equation of least-squares-fit line (slope and y-intercept; 10 points each), correlation coefficient and coefficient of the determination (10 points each) 2. Use two-dimensional array to find the equation of least-squares-fit line (slope and y-intercept; 10 points each), correlation coefficient and coefficient...
i neeed help for my qz2
this one is visual basic , i dont understand how to write
code
QZ2: Linear Regression (100 points) Given: A data table (see next page) Find: 1. Use one-dimensional array to find the equation of least-squares-fit line (slope and y-intercept; 10 points each), correlation coefficient and coefficient of the determination (10 points each) 2. Use two-dimensional array to find the equation of least-squares-fit line (slope and y-intercept; 10 points each), correlation coefficient and coefficient...
Most questions answered within 3 hours.
-
While rotating the tires on your car you notice a rock [mass =
0.1 Kg] stuck...
asked 1 hour ago -
Using MARS simulator, write MIPS programs according to
the following scenarios: Receive a positive integer number...
asked 3 hours ago -
An object in front of a concave mirror has a real image that is
11.5 cm...
asked 3 hours ago -
Consider the reaction, C3 H8 + O2 --> CO2 + H2O. How many
moles of O2...
asked 5 hours ago -
You and your opponent both roll a fair die. If you both roll the
same number,...
asked 5 hours ago -
In a study of the accuracy of fast food drive-through orders,
Restaurant A had 257 accurate...
asked 5 hours ago -
Identify and describe in detail the four categories of
institutions that could be included in a...
asked 5 hours ago -
In python
class Customer:
def __init__(self, customer_id, last_name, first_name, phone_number, address):
self._customer_id = int(customer_id)
self._last_name =...
asked 5 hours ago -
What is an example of a limitation in implementing a new
ERP system and how it...
asked 5 hours ago -
In a section of 9.7cm of an artery with a radius of 2.6mm there
is a...
asked 5 hours ago -
the two carboxylic acid groups of aspartic acid have different
acidities with pKa values of 2.1...
asked 5 hours ago -
Would CuCO3 aqueous salt combined with calcium chloride
form a solid precipitate? If so, what would...
asked 5 hours ago