


Homework Answers
Module Module1
Sub Main()
Console.WriteLine("============= Quiz2: Linear Regression
=============")
Console.WriteLine("++++++++++++++++++++++++++++++++++++++++++++++++++++")
Console.WriteLine("")
' write your name here ,
Console.WriteLine(" written by , March,
2020")
Console.WriteLine("")
Console.WriteLine("++++++++++++++++++++++++++++++++++++++++++++++++++++")
Console.WriteLine("====================================================")
Console.WriteLine("")
Console.WriteLine("")
Console.WriteLine("")
Console.WriteLine("")
' using 1-D array
' X array
Dim X() As Integer = {0, 5, 10, 15, 20, 25, 30, 35, 40}
' Y array
Dim Y() As Integer = {24, 33, 62, 77, 105, 123, 151, 170, 188}
' local variables
Dim m As Double = 0
Dim n As Integer = X.Length
Dim XY_s As Integer = 0
Dim X_s As Integer = 0
Dim Y_s As Integer = 0
Dim X2_s As Integer = 0
Dim Y2_s As Integer = 0
' calculate
For index As Integer = 0 To n - 1
XY_s += X(index) * Y(index)
X_s += X(index)
Y_s += Y(index)
X2_s += X(index) * X(index)
Y2_s += Y(index) * Y(index)
Next
m = (n * XY_s - X_s * Y_s) / (n * X2_s - X_s * X_s)
Dim b As Double = 0
b = (Y_s - m * X_s) / n
Dim r As Double = 0
r = (n * XY_s - X_s * Y_s) / (Math.Sqrt(n * X2_s - X_s * X_s) * Math.Sqrt(n * Y2_s - Y_s * Y_s))
' display
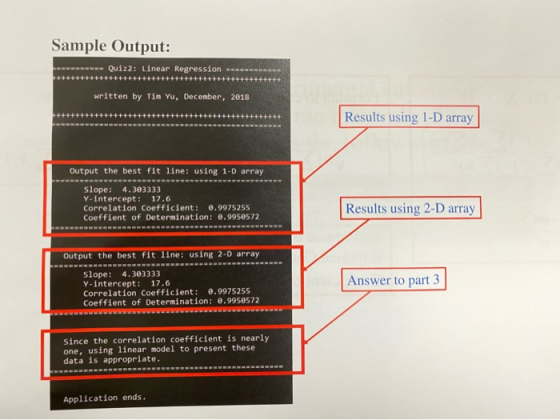
Console.WriteLine(" Output the best fit line: using 1-D
array")
Console.WriteLine("====================================================")
Console.Write(" Slope: ")
Console.WriteLine(m)
Console.Write(" Y-Intercept: ")
Console.WriteLine(b)
Console.Write(" Correlation Coefficient: ")
Console.WriteLine(r)
Console.Write(" Correlation of Determination: ")
Console.WriteLine((r * r))
Console.WriteLine("====================================================")
' using 2-D array
Dim Ary2D(,) As Integer = {{0, 24}, {5, 33}, {10, 62}, {15, 77}, {20, 105}, {25, 123}, {30, 151}, {35, 170}, {40, 188}}
' local variables
Dim m2D As Double = 0
' upper dimension od 2D array
Dim n2D As Integer = Ary2D.GetUpperBound(0)
Dim XY2D_s As Integer = 0
Dim X2D_s As Integer = 0
Dim Y2D_s As Integer = 0
Dim X2_2D_s As Integer = 0
Dim Y2_2D_s As Integer = 0
' calculation
For index As Integer = 0 To n2D - 1
XY2D_s += Ary2D(index, 0) * Ary2D(index, 1)
X2D_s += Ary2D(index, 0)
Y2D_s += Ary2D(index, 1)
X2_2D_s += Ary2D(index, 0) * Ary2D(index, 0)
Y2_2D_s += Ary2D(index, 1) * Ary2D(index, 1)
Next
m2D = (n2D * XY2D_s - X2D_s * Y2D_s) / (n2D * X2_2D_s - X2D_s *
X2D_s)
Dim b2D As Double = 0
b2D = (Y2D_s - m2D * X2D_s) / n2D
Dim r2D As Double = 0
r2D = (n2D * XY2D_s - X2D_s * Y2D_s) / (Math.Sqrt(n2D * X2_2D_s - X2D_s * X2D_s) * Math.Sqrt(n2D * Y2_2D_s - Y2D_s * Y2D_s))
' display
Console.WriteLine("")
Console.WriteLine("")
Console.WriteLine(" Output the best fit line: using 2-D
array")
Console.WriteLine("====================================================")
Console.Write(" Slope: ")
Console.WriteLine(m2D)
Console.Write(" Y-Intercept: ")
Console.WriteLine(b2D)
Console.Write(" Correlation Coefficient: ")
Console.WriteLine(r2D)
Console.Write(" Correlation of Determination: ")
Console.WriteLine((r2D * r2D))
Console.WriteLine("====================================================")
' r and r2D both greater than .5 , that mean near to 1
If r >= 0.5 And r2D >= 0.5 Then
Console.WriteLine("")
Console.WriteLine("")
Console.WriteLine("====================================================")
Console.WriteLine(" Since the correlation coefficient is
nearly")
Console.WriteLine(" one, using linear model to present
these")
Console.WriteLine(" data is appropriate.")
Console.WriteLine("====================================================")
End If
Console.WriteLine("")
Console.WriteLine("")
Console.WriteLine(" Application ends.")
Console.ReadKey()
End Sub
End Module


Add Answer to:
i neeed help for my qz2
this one is visual basic , i dont understand how...
I need help writing the step by step directions (algorithm) for the following C++ code. ex....
I need help writing the step by step directions (algorithm) for the following C++ code. ex. what would be input, output, and inbetween. No computer code! Many properties in engineering and science can be analyzed by trying to fit a straight line which uses x as the independent variable and y as the dependent variable. Suppose you have an array of x values and a corresponding array of y values. Write the process to fit a straight line to the...
3) 6 11 12 15 17 19 TO 7 12 :12 Use least-squares regression to fit a straight line to the list o...
 please solve it with codes in Matlab
3) 6 11 12 15 17 19 TO 7 12 :12 Use least-squares regression to fit a straight line to the list of data in the accompanying table. Give the slope and the intercept Compute the correlation coefficient Give an estimation of y for r 10 Slope: Intercept: Your answer: Your Answer Page 1 of 1
3) 6 11 12 15 17 19 TO 7 12 :12 Use least-squares regression to fit a...
please solve it with codes in Matlab
3) 6 11 12 15 17 19 TO 7 12 :12 Use least-squares regression to fit a straight line to the list of data in the accompanying table. Give the slope and the intercept Compute the correlation coefficient Give an estimation of y for r 10 Slope: Intercept: Your answer: Your Answer Page 1 of 1
3) 6 11 12 15 17 19 TO 7 12 :12 Use least-squares regression to fit a...
I need help answering these questions MULTIPLE CHOICE. Choose the one alternative that best completes the...
 I need help answering these questions
MULTIPLE CHOICE. Choose the one alternative that best completes the statement or answer the question. 1) The purpose of a linear regression line is to A) calculate the correlation coefficient B) display the bivariate distribution of X and Y C) identify the mean of the X and Y variables D) predict one set of scores from another set 2) The general equation for a straight line is expressed as A) Y - X- B)...
I need help answering these questions
MULTIPLE CHOICE. Choose the one alternative that best completes the statement or answer the question. 1) The purpose of a linear regression line is to A) calculate the correlation coefficient B) display the bivariate distribution of X and Y C) identify the mean of the X and Y variables D) predict one set of scores from another set 2) The general equation for a straight line is expressed as A) Y - X- B)...
I need help with parts A B D E and F. Please show hand work for...
 I need help with parts A B D E and F. Please show hand work
for solving A and B while D and E should be matlab codes. How do i
pick the right graph for part F?
5 2 4 6 Linear spline: s fi+ (x-x) 2) Given the points 40 78 125 256 348 425 X1-x a) Write the correct linear spline equation to interpolate for x 4.72, simplifying where appropriate to get to the slope-intercept form. (4...
I need help with parts A B D E and F. Please show hand work
for solving A and B while D and E should be matlab codes. How do i
pick the right graph for part F?
5 2 4 6 Linear spline: s fi+ (x-x) 2) Given the points 40 78 125 256 348 425 X1-x a) Write the correct linear spline equation to interpolate for x 4.72, simplifying where appropriate to get to the slope-intercept form. (4...
Please help me out by giving me detailed answers with formulas. So I can understand fully...
Please help me out by giving me detailed answers with formulas. So I can understand fully Thank you very much A study is conducted to examine the influence of ‘screen time’ on student performance on Statistics exams. A class of 12 students is observed over a period of time, with the independent variable being the average amount of time per day each student spends on TV/internet, and the dependent variable being their subsequent Statistics exam score, in %. The data...
correlation and regression 210 Statistics EXTRA CREDIT Correlation and Regression Formulas written Assignment 1. Follow the...
 correlation and regression
210 Statistics EXTRA CREDIT Correlation and Regression Formulas written Assignment 1. Follow the instructions below to calculate the correlation coefficient and least squares regression line for the data set below. Z 22,- The sample means and sample standard deviations for the two variables are listed below: X = 4 x = 2 3 =5 Sy = 1 The linear correlation coefficient is = 52. Calculate this correlation coefficient using the steps below: (a) First, complete the columns...
correlation and regression
210 Statistics EXTRA CREDIT Correlation and Regression Formulas written Assignment 1. Follow the instructions below to calculate the correlation coefficient and least squares regression line for the data set below. Z 22,- The sample means and sample standard deviations for the two variables are listed below: X = 4 x = 2 3 =5 Sy = 1 The linear correlation coefficient is = 52. Calculate this correlation coefficient using the steps below: (a) First, complete the columns...
Hi can someone please show how this is solved, I have the answer as = 497.9 +/- 0.73 ngL-1 but would just like to know how the answer was reached. Especially to the +/- 0.73 ngL-1 Thank you. 4. The c...
 Hi can someone please show how this is solved, I have the answer
as = 497.9 +/- 0.73 ngL-1 but would just like to know how the
answer was reached. Especially to the +/- 0.73 ngL-1
Thank you.
4. The calibration data for the determination of lead levels in fruit juices by a differential pulse polarography method is shown below. 40 10 30 20 50 Current /HA0.0000.1180.2400.5070.7130.9811.183 When these data were plotted using linear regression a correlation coefficient, R2, of...
Hi can someone please show how this is solved, I have the answer
as = 497.9 +/- 0.73 ngL-1 but would just like to know how the
answer was reached. Especially to the +/- 0.73 ngL-1
Thank you.
4. The calibration data for the determination of lead levels in fruit juices by a differential pulse polarography method is shown below. 40 10 30 20 50 Current /HA0.0000.1180.2400.5070.7130.9811.183 When these data were plotted using linear regression a correlation coefficient, R2, of...
from part 5-12 plz dont do 1-4 BUNUS Assignment! A Sample Data AnalySIS III Licer Please...
 from part 5-12 plz dont do 1-4
BUNUS Assignment! A Sample Data AnalySIS III Licer Please answer all of the following questions. Make sure you show all your work, providing snapshots from Excel as well as listing all formulas and relevant explanation, as needed. We are interested in exploring the relationship between the income of professors (measured in thousands of dollars) and the number of years they have been employed by the university. We collect the following data from eight...
from part 5-12 plz dont do 1-4
BUNUS Assignment! A Sample Data AnalySIS III Licer Please answer all of the following questions. Make sure you show all your work, providing snapshots from Excel as well as listing all formulas and relevant explanation, as needed. We are interested in exploring the relationship between the income of professors (measured in thousands of dollars) and the number of years they have been employed by the university. We collect the following data from eight...
Question 6 (10 marks) Finally, the researcher considers using regression analysis to establish a linear relationship...
Question 6 (10 marks) Finally, the researcher considers using regression analysis to establish a linear relationship between the two variables – hours worked per week and yearly income. a) What is the dependent variable and independent variable for this analysis? Why? (2 marks) b) Use an appropriate plot to investigate the relationship between the two variables. Display the plot. On the same plot, fit a linear trend line including the equation and the coefficient of determination R2 . (2 marks)...
Please answer the following questions using the formula for a and b, thank you! Question 1:...
 Please answer the following questions using the formula for a
and b, thank you!
Question 1: A study is conducted to examine the influence of screen time on student performance on Satis exams A class of 12 students is observed over a period of time, with the independenta le being the we amount of time per day each student spends on TV internet, and the dependent able being their subsequent Statistics eum score, in The data is shown in the...
Please answer the following questions using the formula for a
and b, thank you!
Question 1: A study is conducted to examine the influence of screen time on student performance on Satis exams A class of 12 students is observed over a period of time, with the independenta le being the we amount of time per day each student spends on TV internet, and the dependent able being their subsequent Statistics eum score, in The data is shown in the...
 please solve it with codes in Matlab
3) 6 11 12 15 17 19 TO 7 12 :12 Use least-squares regression to fit a straight line to the list of data in the accompanying table. Give the slope and the intercept Compute the correlation coefficient Give an estimation of y for r 10 Slope: Intercept: Your answer: Your Answer Page 1 of 1
3) 6 11 12 15 17 19 TO 7 12 :12 Use least-squares regression to fit a...
please solve it with codes in Matlab
3) 6 11 12 15 17 19 TO 7 12 :12 Use least-squares regression to fit a straight line to the list of data in the accompanying table. Give the slope and the intercept Compute the correlation coefficient Give an estimation of y for r 10 Slope: Intercept: Your answer: Your Answer Page 1 of 1
3) 6 11 12 15 17 19 TO 7 12 :12 Use least-squares regression to fit a...
 I need help answering these questions
MULTIPLE CHOICE. Choose the one alternative that best completes the statement or answer the question. 1) The purpose of a linear regression line is to A) calculate the correlation coefficient B) display the bivariate distribution of X and Y C) identify the mean of the X and Y variables D) predict one set of scores from another set 2) The general equation for a straight line is expressed as A) Y - X- B)...
I need help answering these questions
MULTIPLE CHOICE. Choose the one alternative that best completes the statement or answer the question. 1) The purpose of a linear regression line is to A) calculate the correlation coefficient B) display the bivariate distribution of X and Y C) identify the mean of the X and Y variables D) predict one set of scores from another set 2) The general equation for a straight line is expressed as A) Y - X- B)...
 I need help with parts A B D E and F. Please show hand work
for solving A and B while D and E should be matlab codes. How do i
pick the right graph for part F?
5 2 4 6 Linear spline: s fi+ (x-x) 2) Given the points 40 78 125 256 348 425 X1-x a) Write the correct linear spline equation to interpolate for x 4.72, simplifying where appropriate to get to the slope-intercept form. (4...
I need help with parts A B D E and F. Please show hand work
for solving A and B while D and E should be matlab codes. How do i
pick the right graph for part F?
5 2 4 6 Linear spline: s fi+ (x-x) 2) Given the points 40 78 125 256 348 425 X1-x a) Write the correct linear spline equation to interpolate for x 4.72, simplifying where appropriate to get to the slope-intercept form. (4...
 correlation and regression
210 Statistics EXTRA CREDIT Correlation and Regression Formulas written Assignment 1. Follow the instructions below to calculate the correlation coefficient and least squares regression line for the data set below. Z 22,- The sample means and sample standard deviations for the two variables are listed below: X = 4 x = 2 3 =5 Sy = 1 The linear correlation coefficient is = 52. Calculate this correlation coefficient using the steps below: (a) First, complete the columns...
correlation and regression
210 Statistics EXTRA CREDIT Correlation and Regression Formulas written Assignment 1. Follow the instructions below to calculate the correlation coefficient and least squares regression line for the data set below. Z 22,- The sample means and sample standard deviations for the two variables are listed below: X = 4 x = 2 3 =5 Sy = 1 The linear correlation coefficient is = 52. Calculate this correlation coefficient using the steps below: (a) First, complete the columns...
 Hi can someone please show how this is solved, I have the answer
as = 497.9 +/- 0.73 ngL-1 but would just like to know how the
answer was reached. Especially to the +/- 0.73 ngL-1
Thank you.
4. The calibration data for the determination of lead levels in fruit juices by a differential pulse polarography method is shown below. 40 10 30 20 50 Current /HA0.0000.1180.2400.5070.7130.9811.183 When these data were plotted using linear regression a correlation coefficient, R2, of...
Hi can someone please show how this is solved, I have the answer
as = 497.9 +/- 0.73 ngL-1 but would just like to know how the
answer was reached. Especially to the +/- 0.73 ngL-1
Thank you.
4. The calibration data for the determination of lead levels in fruit juices by a differential pulse polarography method is shown below. 40 10 30 20 50 Current /HA0.0000.1180.2400.5070.7130.9811.183 When these data were plotted using linear regression a correlation coefficient, R2, of...
 from part 5-12 plz dont do 1-4
BUNUS Assignment! A Sample Data AnalySIS III Licer Please answer all of the following questions. Make sure you show all your work, providing snapshots from Excel as well as listing all formulas and relevant explanation, as needed. We are interested in exploring the relationship between the income of professors (measured in thousands of dollars) and the number of years they have been employed by the university. We collect the following data from eight...
from part 5-12 plz dont do 1-4
BUNUS Assignment! A Sample Data AnalySIS III Licer Please answer all of the following questions. Make sure you show all your work, providing snapshots from Excel as well as listing all formulas and relevant explanation, as needed. We are interested in exploring the relationship between the income of professors (measured in thousands of dollars) and the number of years they have been employed by the university. We collect the following data from eight...
 Please answer the following questions using the formula for a
and b, thank you!
Question 1: A study is conducted to examine the influence of screen time on student performance on Satis exams A class of 12 students is observed over a period of time, with the independenta le being the we amount of time per day each student spends on TV internet, and the dependent able being their subsequent Statistics eum score, in The data is shown in the...
Please answer the following questions using the formula for a
and b, thank you!
Question 1: A study is conducted to examine the influence of screen time on student performance on Satis exams A class of 12 students is observed over a period of time, with the independenta le being the we amount of time per day each student spends on TV internet, and the dependent able being their subsequent Statistics eum score, in The data is shown in the...
Most questions answered within 3 hours.
-
what effect on total protein concentration would you
expect to see during dehydration? explain your reasoning.
asked 33 minutes ago -
There are balls numbered 1, 2, 3, 4, 5, 6, 7 in a box, 2 balls...
asked 28 minutes ago -
You are the operations manager of a firm that uses the
continuous review inventory control system....
asked 3 hours ago -
Cost and fair value data for the trading debt securities of
Wildhorse Company at December 31,...
asked 5 hours ago -
In a population of jaguars, a gene with two alleles encodes the
fur color. Allele B...
asked 6 hours ago -
Two copper wires, one 1.80 times the diameter of the other, have
the same current flowing...
asked 6 hours ago -
9. In 2003 the price of ‘home heating oil’ substantially
increased during the harsh winter. In...
asked 6 hours ago -
Match the key paradoxes of negotiation.
Claiming Value
Sticking by your principles
Sticking with your strategy...
asked 7 hours ago -
Question text Suppose a sample of 28 observations is taken from
a population, and the sample...
asked 8 hours ago -
The mayor of a small town estimates that 33% of the
residents in the town favor...
asked 9 hours ago -
1. True or false: According to the Gordon Growth Model, firms
that pay dividends will always...
asked 9 hours ago -
20
Lansing Corporation reported net income of $67 million for last
year. Depreciation expense totaled $15...
asked 10 hours ago