

Homework Answers
Answer:
a)


 c)
c)

g)

![ΣΧ= 48.6, ΣΥ= 775, ΣΧ.Υ = 2668.5, Σx? = 249.32, ΣΥ? = 58501 η ΣΧΥ - ΣΧΣΥ τη ΣΧ? - (ΣΧ)?] - [nΣΥ? - (ΣΥ] 12 - 2668.5 – 48.6 -](http://img.homeworklib.com/questions/7162c8f0-86e0-11eb-bec5-27d329fffae8.png?x-oss-process=image/resize,w_560)
Add Answer to:
Please answer the following questions using the formula for a
and b, thank you!
Question 1:...
Please help me out by giving me detailed answers with formulas. So I can understand fully...
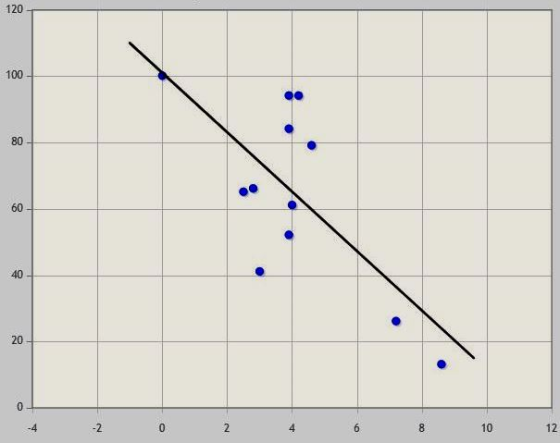
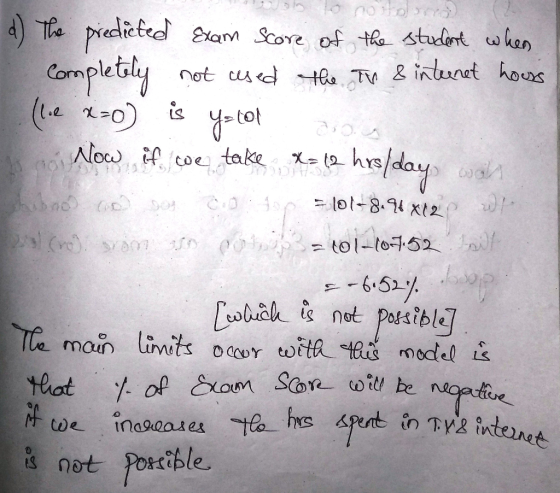
Please help me out by giving me detailed answers with formulas. So I can understand fully Thank you very much A study is conducted to examine the influence of ‘screen time’ on student performance on Statistics exams. A class of 12 students is observed over a period of time, with the independent variable being the average amount of time per day each student spends on TV/internet, and the dependent variable being their subsequent Statistics exam score, in %. The data...
What is the relationship between the amount of time statistics students study per week and their...
 What is the relationship between the amount of time statistics students study per week and their final exam scores? The results of the survey are shown below. Time Score 3 67 13 95 6 15 77 89 13 100 3 66 7 63 11 79 1 59 a. Find the correlation coefficient: r = Round to 2 decimal places. b. The null and alternative hypotheses for correlation are: Ho: ? D = 0 H: ? *0 The p-value is: (Round...
What is the relationship between the amount of time statistics students study per week and their...
What is the relationship between the amount of time statistics students study per week and their final exam scores? The results of the survey are shown below. Time 12 0 3 14 14 9 0 13 10 Score 95 60 73 85 86 89 65 97 93 Find the correlation coefficient: r=r= Round to 2 decimal places. The null and alternative hypotheses for correlation are: H0:H0: ? μ ρ r == 0 H1:H1: ? ρ μ r ≠≠ 0 The p-value is: (Round...
PLEASE COMPLETE THE FOLLOWING FIVE STEPS OF ANOVA AND FILL IN THE BLANKS. THANKS IN ADVANCE...
 PLEASE COMPLETE THE FOLLOWING FIVE STEPS OF ANOVA AND FILL IN
THE BLANKS. THANKS IN ADVANCE
3. Five steps of ANOVA Suppose you are interested in how a person's marital status is related to his or her leisure activities. You randomly sample 21 adults and determine the number of hours each person spends per day watching TV or using the Internet for nonwork activities. The data are shown in the following table: Divorced Single Married 5 2 5 mm Nm...
PLEASE COMPLETE THE FOLLOWING FIVE STEPS OF ANOVA AND FILL IN
THE BLANKS. THANKS IN ADVANCE
3. Five steps of ANOVA Suppose you are interested in how a person's marital status is related to his or her leisure activities. You randomly sample 21 adults and determine the number of hours each person spends per day watching TV or using the Internet for nonwork activities. The data are shown in the following table: Divorced Single Married 5 2 5 mm Nm...
Please provide excel formulas Stat 3309 - Statistical Analysis for Business Applications I Consider the following...
 Please provide excel formulas Stat 3309 - Statistical Analysis for Business Applications I Consider the following data representing the total time in hours) a student spent on reviewing for the Stat 3309 final exam and the actual score on the final. The sample of 10 students was taken from a class and the following answers were reported. time score 0 23 4 30 5 32 7 50 8 45 10 55 12 60 15 70 18 80 20 100 Part...
What is the relationship between the amount of time statistics students study per week and their...
What is the relationship between the amount of time statistics students study per week and their test scores? The results of the survey are shown below. Time 13 10 9 9 2 10 12 8 Score 84 83 90 76 74 86 99 85 x-values y-values Find the correlation coefficient: r=r= Round to 2 decimal places. The null and alternative hypotheses for correlation are: H0:H0: ? r ρ μ == 0 H1:H1: ? μ ρ r ≠≠ 0 The p-value is: (Round to...
please answer this economics question completely..thank you its urgent. a. III- (5pts) In an econometrics course,...
 please answer this economics
question completely..thank you its urgent.
a. III- (5pts) In an econometrics course, the relationship between the expected score earned by students s related to the time in minutes) spent taking it, according to the following model: E(Score/Time) = 49+0.24Time What is the estimated effect of an additional 10 minutes on a student's score? b. Find the expected Score for a student who is given 120 minutes to complete the exam. (1pt) c. If the student in...
please answer this economics
question completely..thank you its urgent.
a. III- (5pts) In an econometrics course, the relationship between the expected score earned by students s related to the time in minutes) spent taking it, according to the following model: E(Score/Time) = 49+0.24Time What is the estimated effect of an additional 10 minutes on a student's score? b. Find the expected Score for a student who is given 120 minutes to complete the exam. (1pt) c. If the student in...
Question 1 Which of the following choices best describes the scatterplot shown below? Group of answer...
Question 1 Which of the following choices best describes the scatterplot shown below? Group of answer choices Linear, negative, strong No form, weak Linear, positive, strong Curved, weak Question 2 Which of the following choices is most likely to be the correlation of the data in the scatterplot shown below? Group of answer choices -0.14 1.04 0.86 -0.92 Question 3 Most roller coasters get their speed by dropping down a steep initial incline, so it makes sense that we can...
Erika Diaz Your name Assignment 10 Correlation, Scatterplot, and Prediction (due 7/30/20 - 1/4/20)(28 pts) 1....
 Erika Diaz Your name Assignment 10 Correlation, Scatterplot, and Prediction (due 7/30/20 - 1/4/20)(28 pts) 1. A teacher hypothesizes that the more days of school student misses, the worse the student will do on a final exam (possible scores on the exam range from 0 to 20). She obtained a random sample of 12 students. The data are shown below. Student days missed Final exam score 1 3 16 2 2 17 3 5 13 4 8 7 5 4...
Can you please answers these four questions as aoin as possible please and thank you! Given...
 Can you please answers these four questions as aoin as
possible please and thank you!
Given are five observations for two variables, z and y 5 13 20 18 48 57 11 27 a. Choose the corre rect scatter diagram for these data: A. B. 60+ 60 50 50 40 40 30+ 30 20 20 10 10- 10 20 30 40 50 60 x 10 20 30 40 50 60 57 x y 60 60 50+ 50- 40- 40+ 30-...
Can you please answers these four questions as aoin as
possible please and thank you!
Given are five observations for two variables, z and y 5 13 20 18 48 57 11 27 a. Choose the corre rect scatter diagram for these data: A. B. 60+ 60 50 50 40 40 30+ 30 20 20 10 10- 10 20 30 40 50 60 x 10 20 30 40 50 60 57 x y 60 60 50+ 50- 40- 40+ 30-...
 What is the relationship between the amount of time statistics students study per week and their final exam scores? The results of the survey are shown below. Time Score 3 67 13 95 6 15 77 89 13 100 3 66 7 63 11 79 1 59 a. Find the correlation coefficient: r = Round to 2 decimal places. b. The null and alternative hypotheses for correlation are: Ho: ? D = 0 H: ? *0 The p-value is: (Round...
 PLEASE COMPLETE THE FOLLOWING FIVE STEPS OF ANOVA AND FILL IN
THE BLANKS. THANKS IN ADVANCE
3. Five steps of ANOVA Suppose you are interested in how a person's marital status is related to his or her leisure activities. You randomly sample 21 adults and determine the number of hours each person spends per day watching TV or using the Internet for nonwork activities. The data are shown in the following table: Divorced Single Married 5 2 5 mm Nm...
PLEASE COMPLETE THE FOLLOWING FIVE STEPS OF ANOVA AND FILL IN
THE BLANKS. THANKS IN ADVANCE
3. Five steps of ANOVA Suppose you are interested in how a person's marital status is related to his or her leisure activities. You randomly sample 21 adults and determine the number of hours each person spends per day watching TV or using the Internet for nonwork activities. The data are shown in the following table: Divorced Single Married 5 2 5 mm Nm...
 Please provide excel formulas Stat 3309 - Statistical Analysis for Business Applications I Consider the following data representing the total time in hours) a student spent on reviewing for the Stat 3309 final exam and the actual score on the final. The sample of 10 students was taken from a class and the following answers were reported. time score 0 23 4 30 5 32 7 50 8 45 10 55 12 60 15 70 18 80 20 100 Part...
 please answer this economics
question completely..thank you its urgent.
a. III- (5pts) In an econometrics course, the relationship between the expected score earned by students s related to the time in minutes) spent taking it, according to the following model: E(Score/Time) = 49+0.24Time What is the estimated effect of an additional 10 minutes on a student's score? b. Find the expected Score for a student who is given 120 minutes to complete the exam. (1pt) c. If the student in...
please answer this economics
question completely..thank you its urgent.
a. III- (5pts) In an econometrics course, the relationship between the expected score earned by students s related to the time in minutes) spent taking it, according to the following model: E(Score/Time) = 49+0.24Time What is the estimated effect of an additional 10 minutes on a student's score? b. Find the expected Score for a student who is given 120 minutes to complete the exam. (1pt) c. If the student in...
 Erika Diaz Your name Assignment 10 Correlation, Scatterplot, and Prediction (due 7/30/20 - 1/4/20)(28 pts) 1. A teacher hypothesizes that the more days of school student misses, the worse the student will do on a final exam (possible scores on the exam range from 0 to 20). She obtained a random sample of 12 students. The data are shown below. Student days missed Final exam score 1 3 16 2 2 17 3 5 13 4 8 7 5 4...
 Can you please answers these four questions as aoin as
possible please and thank you!
Given are five observations for two variables, z and y 5 13 20 18 48 57 11 27 a. Choose the corre rect scatter diagram for these data: A. B. 60+ 60 50 50 40 40 30+ 30 20 20 10 10- 10 20 30 40 50 60 x 10 20 30 40 50 60 57 x y 60 60 50+ 50- 40- 40+ 30-...
Can you please answers these four questions as aoin as
possible please and thank you!
Given are five observations for two variables, z and y 5 13 20 18 48 57 11 27 a. Choose the corre rect scatter diagram for these data: A. B. 60+ 60 50 50 40 40 30+ 30 20 20 10 10- 10 20 30 40 50 60 x 10 20 30 40 50 60 57 x y 60 60 50+ 50- 40- 40+ 30-...
Most questions answered within 3 hours.
-
A coach uses a new technique to train gymnasts. Seven
gymnasts were randomly selected and their...
asked 1 hour ago -
While rotating the tires on your car you notice a rock [mass =
0.1 Kg] stuck...
asked 3 hours ago -
Using MARS simulator, write MIPS programs according to
the following scenarios: Receive a positive integer number...
asked 5 hours ago -
An object in front of a concave mirror has a real image that is
11.5 cm...
asked 5 hours ago -
Consider the reaction, C3 H8 + O2 --> CO2 + H2O. How many
moles of O2...
asked 7 hours ago -
You and your opponent both roll a fair die. If you both roll the
same number,...
asked 7 hours ago -
In a study of the accuracy of fast food drive-through orders,
Restaurant A had 257 accurate...
asked 7 hours ago -
Identify and describe in detail the four categories of
institutions that could be included in a...
asked 7 hours ago -
In python
class Customer:
def __init__(self, customer_id, last_name, first_name, phone_number, address):
self._customer_id = int(customer_id)
self._last_name =...
asked 7 hours ago -
What is an example of a limitation in implementing a new
ERP system and how it...
asked 7 hours ago -
In a section of 9.7cm of an artery with a radius of 2.6mm there
is a...
asked 7 hours ago -
the two carboxylic acid groups of aspartic acid have different
acidities with pKa values of 2.1...
asked 7 hours ago