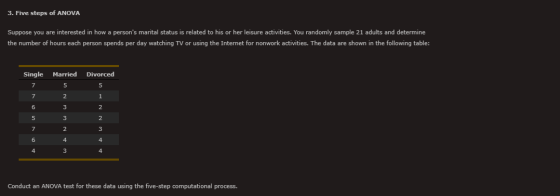


PLEASE COMPLETE THE FOLLOWING FIVE STEPS OF ANOVA AND FILL IN THE BLANKS. THANKS IN ADVANCE
Homework Answers
Step 1
Level of measurement is Nominal.
Populations are normally distributed
Population variances are same.
Step 2
Option B
H0: The average time spent watching TV or using the Internet is the same, regardless of martial status.
H1:
Option B
At least one of the population means is different
Step 3
Alpha = 0.01
N = 21
n = 7
Degress of Freedom:
dfBetween = a – 1 = 3-1 =2
dfWithin = N-a = 21-3 = 18
dfTotal = N-1 = 21-1 = 20
F Critical (dfBetween, dfWithin): (2,18) = 6.01
The degrees of freedom within is dfw = 18
The degrees of freedom between is dfb = 2
F Critical (dfBetween, dfWithin): (2,18) = 6.01
Step 4
SSBetwen = ∑(∑ai)2/n - T2/N = 40.10
SSWithin = ∑(Y)2 - ∑(∑ai)2/n = 26.86
SSTotal = SSBetwen + SSWithin = 66.95
MS = SS/df
MSBetween = SSBetween/dfBetween = 40.10/2 = 20.05
MSWithin = SSWithin/dfWithin = 26.86/18 = 1.49
F = MSeffect / MSerror = 20.05/1.49 = 13.44
Hence,
SST = 66.95; SSB = 40.10; SSW = 26.86;
MSBetween = 40.10/2 = 20.05
MSWithin = 26.86/18 = 1.49
F = 13.44
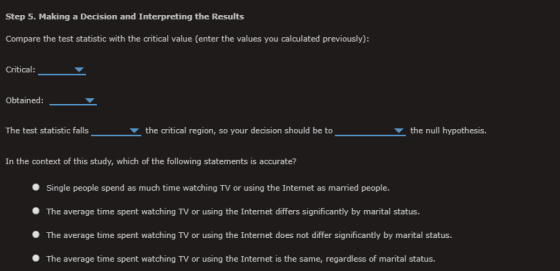
Step 5
Critical = 6.01
Obtained = 13.44
The test statistic falls outside the critical region, so your decision should be to reject the null hypothesis.
Option B
The average time spent watching TV or using the Internet differs significantly by martial status.
Add Answer to:
PLEASE COMPLETE THE FOLLOWING FIVE STEPS OF ANOVA AND FILL IN
THE BLANKS. THANKS IN ADVANCE...
Using the accompanying data of a TV viewing survey, conduct a hypothesis test to determine if...
 Using the accompanying data of a TV viewing survey, conduct a hypothesis test to determine if married individuals watch less TV than single individuals. Assume that the population variances are unequal. E Click the icon to view the TV viewing survey. Survey data Х Is there sufficient evidence at the 0.05 level of significance that the married individuals watch less TV than single individuals? Determine the null hypothesis, Ho, and the alternative hypothesis, Hy. Let married people be population 1...
Can I get some help with these questions please,thank you The marital status distribution of the...
 Can I get some help with these questions please,thank
you
The marital status distribution of the U.S. male population, age 15 and older, is as shown below. Marital Status Percent never married 31.3 married 56.1 widowed 2.5 divorced/separated 10.1 Suppose that a random sample of 400 U.S. young adult males, 18 to 24 years old, yielded the following frequency distribution. We are interested in whether this age group of males fits the distribution of the U.S. adult population at the...
Can I get some help with these questions please,thank
you
The marital status distribution of the U.S. male population, age 15 and older, is as shown below. Marital Status Percent never married 31.3 married 56.1 widowed 2.5 divorced/separated 10.1 Suppose that a random sample of 400 U.S. young adult males, 18 to 24 years old, yielded the following frequency distribution. We are interested in whether this age group of males fits the distribution of the U.S. adult population at the...
The marital status distribution of the U.S. male population, age 15 and older, is as shown...
The marital status distribution of the U.S. male population, age 15 and older, is as shown below. Marital Status Percent never married 31.3 married 56.1 widowed 2.5 divorced/separated 10.1 Suppose that a random sample of 400 U.S. young adult males, 18 to 24 years old, yielded the following frequency distribution. We are interested in whether this age group of males fits the distribution of the U.S. adult population at the 5% level. Calculate the frequency one would expect when surveying...
Which of the following statements about the one-way ANOVA are correct?
Which of the following statements about the one-way ANOVA are correct? (Select all that apply) The larger the variability within groups relative to the variability between groups, the larger the F test statistic tends to be. The results of the ANOVA F test does not tel us which groups are different or how different they are. An F-distribution is symmetrical about 0 and extends indefinitely in both directions In a one-way ANOVA, if the null hypothesis is rejected, we conclude that the population means...
Please answer the following questions using the formula for a and b, thank you! Question 1:...
 Please answer the following questions using the formula for a
and b, thank you!
Question 1: A study is conducted to examine the influence of screen time on student performance on Satis exams A class of 12 students is observed over a period of time, with the independenta le being the we amount of time per day each student spends on TV internet, and the dependent able being their subsequent Statistics eum score, in The data is shown in the...
Please answer the following questions using the formula for a
and b, thank you!
Question 1: A study is conducted to examine the influence of screen time on student performance on Satis exams A class of 12 students is observed over a period of time, with the independenta le being the we amount of time per day each student spends on TV internet, and the dependent able being their subsequent Statistics eum score, in The data is shown in the...
Please help me out by giving me detailed answers with formulas. So I can understand fully...
Please help me out by giving me detailed answers with formulas. So I can understand fully Thank you very much A study is conducted to examine the influence of ‘screen time’ on student performance on Statistics exams. A class of 12 students is observed over a period of time, with the independent variable being the average amount of time per day each student spends on TV/internet, and the dependent variable being their subsequent Statistics exam score, in %. The data...
Does a person's educational level affect his or her decision about marrying? A survey asked a...
 Does a person's educational level affect his or her decision about marrying? A survey asked a random sample of 1397 U.S. adults about their education level and marital status. The results are summarized below. Education and Marital Status Education Level Marital Status Less HS HS College Total Single/Widowed 6 115 256 377 Married 18 256 442 716 Divorced 13 136 155 304 Total 37 507 853 1397 (3 decimal places) (a) The cell with the highest observed count contains a...
Watching TV: The 2012 general Social Survey asked a large number of people how much time...
 Watching TV: The 2012 general Social Survey asked a large number of people how much time they spent watching TV each day. The mean number of hours was 3.09 with a standard deviation of 2.72. Assume that in a sample of 34 teenagers, the sample standard deviation of daily TV time is 1.9 hours, and that the population of TV watching times is normally distributed. Can you conclude that the population standard deviation of TV watching times for teenagers differs...
Consider the partially completed cne-way ANOVA summary table below. a) Complete the remaining entries in the...
 Consider the partially completed cne-way ANOVA summary table below. a) Complete the remaining entries in the table. b) How many population means are being tested? c) Using α-0.05, what conclusions can be made concerning the population means? Source Between Within Total Sum of Squares De of Freedom Mean Sum of Squares 112 193 19 Click the icon to view a table of critical F-sccres for a 0.05. a) Complete the ANOVA table below. Sum of Degrees of Mean Sum of...
Consider the partially completed one-way ANOVA summary table below. a) Complete the remaining entries in the...
 Consider the partially completed one-way ANOVA summary table below. a) Complete the remaining entries in the table. b) How many population means are being tested? c) Using a = 0.05, what conclusions can be made concerning the population means? Sum of Squares Degrees of Freedom Mean Sum of Squares w Source Between Within Total Click the icon to view a table of critical F-scores for a = 0.05. a) Complete the ANOVA table below. Sum of Degrees of Mean Sum...
 Using the accompanying data of a TV viewing survey, conduct a hypothesis test to determine if married individuals watch less TV than single individuals. Assume that the population variances are unequal. E Click the icon to view the TV viewing survey. Survey data Х Is there sufficient evidence at the 0.05 level of significance that the married individuals watch less TV than single individuals? Determine the null hypothesis, Ho, and the alternative hypothesis, Hy. Let married people be population 1...
 Can I get some help with these questions please,thank
you
The marital status distribution of the U.S. male population, age 15 and older, is as shown below. Marital Status Percent never married 31.3 married 56.1 widowed 2.5 divorced/separated 10.1 Suppose that a random sample of 400 U.S. young adult males, 18 to 24 years old, yielded the following frequency distribution. We are interested in whether this age group of males fits the distribution of the U.S. adult population at the...
Can I get some help with these questions please,thank
you
The marital status distribution of the U.S. male population, age 15 and older, is as shown below. Marital Status Percent never married 31.3 married 56.1 widowed 2.5 divorced/separated 10.1 Suppose that a random sample of 400 U.S. young adult males, 18 to 24 years old, yielded the following frequency distribution. We are interested in whether this age group of males fits the distribution of the U.S. adult population at the...
 Please answer the following questions using the formula for a
and b, thank you!
Question 1: A study is conducted to examine the influence of screen time on student performance on Satis exams A class of 12 students is observed over a period of time, with the independenta le being the we amount of time per day each student spends on TV internet, and the dependent able being their subsequent Statistics eum score, in The data is shown in the...
Please answer the following questions using the formula for a
and b, thank you!
Question 1: A study is conducted to examine the influence of screen time on student performance on Satis exams A class of 12 students is observed over a period of time, with the independenta le being the we amount of time per day each student spends on TV internet, and the dependent able being their subsequent Statistics eum score, in The data is shown in the...
 Does a person's educational level affect his or her decision about marrying? A survey asked a random sample of 1397 U.S. adults about their education level and marital status. The results are summarized below. Education and Marital Status Education Level Marital Status Less HS HS College Total Single/Widowed 6 115 256 377 Married 18 256 442 716 Divorced 13 136 155 304 Total 37 507 853 1397 (3 decimal places) (a) The cell with the highest observed count contains a...
 Watching TV: The 2012 general Social Survey asked a large number of people how much time they spent watching TV each day. The mean number of hours was 3.09 with a standard deviation of 2.72. Assume that in a sample of 34 teenagers, the sample standard deviation of daily TV time is 1.9 hours, and that the population of TV watching times is normally distributed. Can you conclude that the population standard deviation of TV watching times for teenagers differs...
 Consider the partially completed cne-way ANOVA summary table below. a) Complete the remaining entries in the table. b) How many population means are being tested? c) Using α-0.05, what conclusions can be made concerning the population means? Source Between Within Total Sum of Squares De of Freedom Mean Sum of Squares 112 193 19 Click the icon to view a table of critical F-sccres for a 0.05. a) Complete the ANOVA table below. Sum of Degrees of Mean Sum of...
 Consider the partially completed one-way ANOVA summary table below. a) Complete the remaining entries in the table. b) How many population means are being tested? c) Using a = 0.05, what conclusions can be made concerning the population means? Sum of Squares Degrees of Freedom Mean Sum of Squares w Source Between Within Total Click the icon to view a table of critical F-scores for a = 0.05. a) Complete the ANOVA table below. Sum of Degrees of Mean Sum...
Most questions answered within 3 hours.
-
Two electrons are initially at rest separated by a distance of
2nm. At time t=0, they...
asked 8 seconds ago -
Magnesium and nitrogen react in a combination reaction to
produce magnesium nitride. 3 Mg + N2...
asked 2 minutes ago -
A martial artist is practicing breaking 5 boards. He is able to
break aboard with probability...
asked 7 minutes ago -
The rate constant of a first-order reaction is 2.95 × 10⁻⁴ s−1
at 350.° C. If...
asked 10 minutes ago -
implement a class called PiggyBank that will be used to
represent a collection of coins. Functionality...
asked 1 minute ago -
2. Use the following information in the table to answer the
following questions. (Numbers are in...
asked 7 minutes ago -
The fuel economy of a 2011 Lexus RX 350 2wd 6 cylinder 3.5 L
automatic 5...
asked 15 minutes ago -
i.
the synthesized compund 2-bromo-butanal i have a IR peak at about
3200 and one at...
asked 15 minutes ago -
A
752 mL sample of water was placed in a 1000 gram pan of aluminum.
The...
asked 26 minutes ago -
1.In the context of chelation, what does binding strength mean?
What happens at the molecular level...
asked 19 minutes ago -
Describe two obstacles that makes fixing atmospheric nitrogen
difficult.
asked 39 minutes ago -
Evelyn incorporates her sole proprietorship, transferring it to
newly formed Papaya Corporation. The assets transferred have...
asked 25 minutes ago