
Homework Answers
Add Answer to:
1. The following frequency distribution shows the results of a sample of elementary school children. The...
1. The following frequency distribution shows the results of a sample of elementary school children. The...
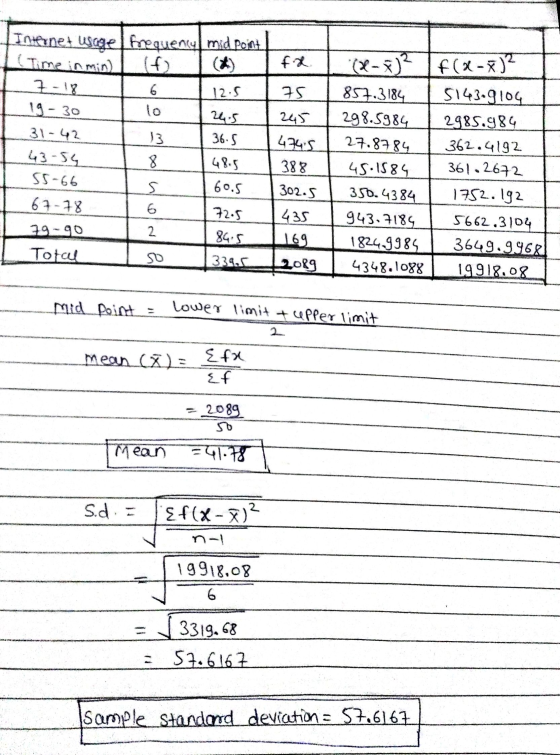
 1. The following frequency distribution shows the results of a sample of elementary school children. The study was to determine the number of minutes per day that elementary school children spend on the internet (outside of school activities). Frequency 6 10 Internet Usage (Time in Min) 7 - 18 19 - 30 31 - 42 43 - 54 55 - 66 67 - 78 79-90 13 8 5 6 2 Find the mean internet usage time. Round answer to one...
Calculate the sample standard deviation and sample variance for the following frequency distribution of heart rates...
Calculate the sample standard deviation and sample variance for the following frequency distribution of heart rates for a sample of American adults. If necessary, round to one more decimal place than the largest number of decimal places given in the data. Heart Rates in Beats per Minute Class Frequency CLASS FREQUENCY 61-66 2 67-72 11 73-78 11 79-84 3 85-90 8
The following scores represent the final examination grades for an elementary statistics course:
The following scores represent the final examination grades for an elementary statistics course: 23 60 79 32 57 74 52 70 82 36 80 77 81 95 41 65 92 85 55 76 52 10 64 75 78 25 80 98 81 67 41 71 83 54 64 72 88 62 74 43 60 78 89 76 84 48 84 90 15 79 34 67 17 82 69 74 63 80 85 61 Calculate: Stem and leaf Relative frequency histogram Cumulative frequency Sample Mean Sample Median Mode Variance Standard deviation
02 The following scores represent the final examination grades for an elementary statistics course: 23 60...
 02 The following scores represent the final examination grades for an elementary statistics course: 23 60 79 32 57 74 52 70 82 36 80 77 81 95 41 65 92 85 55 76 52 10 64 75 78 25 80 98 81 67 41 71 83 54 64 72 88 62 74 43 60 78 89 76 84 48 84 90 15 79 34 67 17 82 69 74 63 80 85 61 Calculate: . Stem and leaf ....
Imagine that you are doing an exhaustive study on the children in all of the elementary...
 Imagine that you are doing an exhaustive study on the children in all of the elementary schools in your school district. You are particularly interested in how much time children spend doing active play on weekends. You find that for this population of 2,431 children, the average number of minutes spent doing active play on weekends is μ = 87.85, with a standard deviation of ơ-118.1. You select a random sample of 25 children of elementary school age in this...
Use the following information to answer questions (1012). A researcher believes that children who attend elementary...
 Use the following information to answer questions (1012). A researcher believes that children who attend elementary school in a rural setting toopulation 1) are more physically active than children who attend elementary school in an urban setting (population 2). The researcher collects random sample from each population and records the proportion of children in each sample who reported participating in at least one hour of rigorous activity day. Assume the all conditions for proceeding with a two-sample test have been...
Calculate the sample mean and sample variance for the following frequency distribution of heart rates for...
Calculate the sample mean and sample variance for the following frequency distribution of heart rates for a sample of American adults. If necessary, round to one more decimal place than the largest number of decimal places given in the data. Heart Rates in Beats per Minute Class Frequency 51 - 58 51 - 58 4 4 59 - 66 59 - 66 10 10 67 - 74 67 - 74 2 2 75 - 82 75 - 82 12 12...
Use the following information to answer questions (10)-(12). A researcher believes that children who attend elementary...
 Use the following information to answer questions (10)-(12). A researcher believes that children who attend elementary school in a rural setting (population 1) are more physically active than children who attend elementary school in an urban setting (population 2). The researcher collects a random sample from each population and records the proportion of children in each sample who reported participatir in at least one hour of rigorous activity a day. Assume the all conditions for proceeding with a two-sample test...
Frequency and Relative Frequency Distribution.
 1. Frequency and Relative Frequency Distribution. What is the shape of the distribution of your sample data? Which class best estimates the center of the distribution? Do you have any modes? Are there any outliers? Make a guess as to the shape of the population distribution from the above histogram.Use 2 decimal places for all values. Confidence interval Construction Validate the Assumptions/Conditions to construct a 95% Confidence interval. What is the symbol and value of the critical value for this interval? (You must interpolate.) Write the formula...
Suppose that a study of elementary school students reports that the mean age at which children...
 Suppose that a study of elementary school students reports that the mean age at which children begin reading is 5.7 years with a standard deviation of 0.7 years. Step 1 of 2: If a sampling distribution is created using samples of the ages at which 55 children begin reading, what would be the mean of the sampling distribution of sample means? Round to two decimal places, if necessary. Tables Keypad Answer 2 Points 2019 Hawkes Learning here to search
 1. The following frequency distribution shows the results of a sample of elementary school children. The study was to determine the number of minutes per day that elementary school children spend on the internet (outside of school activities). Frequency 6 10 Internet Usage (Time in Min) 7 - 18 19 - 30 31 - 42 43 - 54 55 - 66 67 - 78 79-90 13 8 5 6 2 Find the mean internet usage time. Round answer to one...
 02 The following scores represent the final examination grades for an elementary statistics course: 23 60 79 32 57 74 52 70 82 36 80 77 81 95 41 65 92 85 55 76 52 10 64 75 78 25 80 98 81 67 41 71 83 54 64 72 88 62 74 43 60 78 89 76 84 48 84 90 15 79 34 67 17 82 69 74 63 80 85 61 Calculate: . Stem and leaf ....
 Imagine that you are doing an exhaustive study on the children in all of the elementary schools in your school district. You are particularly interested in how much time children spend doing active play on weekends. You find that for this population of 2,431 children, the average number of minutes spent doing active play on weekends is μ = 87.85, with a standard deviation of ơ-118.1. You select a random sample of 25 children of elementary school age in this...
 Use the following information to answer questions (1012). A researcher believes that children who attend elementary school in a rural setting toopulation 1) are more physically active than children who attend elementary school in an urban setting (population 2). The researcher collects random sample from each population and records the proportion of children in each sample who reported participating in at least one hour of rigorous activity day. Assume the all conditions for proceeding with a two-sample test have been...
 Use the following information to answer questions (10)-(12). A researcher believes that children who attend elementary school in a rural setting (population 1) are more physically active than children who attend elementary school in an urban setting (population 2). The researcher collects a random sample from each population and records the proportion of children in each sample who reported participatir in at least one hour of rigorous activity a day. Assume the all conditions for proceeding with a two-sample test...
 Suppose that a study of elementary school students reports that the mean age at which children begin reading is 5.7 years with a standard deviation of 0.7 years. Step 1 of 2: If a sampling distribution is created using samples of the ages at which 55 children begin reading, what would be the mean of the sampling distribution of sample means? Round to two decimal places, if necessary. Tables Keypad Answer 2 Points 2019 Hawkes Learning here to search
Most questions answered within 3 hours.
-
A uniform magnetic field is perpendicular to the plane of a wire
loop. If the loop...
asked 5 minutes ago -
Preparation of Benzoic Acid using a Grignard Reagent URGENT
1. During your Grignard formation, a small...
asked 6 minutes ago -
At the peak of your career, your were earning $120,000 and
holding a top level position....
asked 8 minutes ago -
. A permanent magnet is dropped south-end-down through a horizontal
circular coil with a radius of...
asked 10 minutes ago -
Bernie's Beverages purchased some fixed assets classified as
5-year property for MACRS. The assets cost $28,000....
asked 24 minutes ago -
How many ATPs are produced from the catabolism of a 10-C
molecule of fatty acid under...
asked 29 minutes ago -
Before practicing a routine on the rings, a 64.8 kg gymnast
hangs motionless, with one hand...
asked 30 minutes ago -
If the K b of a weak base is 6.3 × 10 − 6 , what...
asked 37 minutes ago -
Which of the following is the minimum amount of moles of NaOH
that must be added...
asked 40 minutes ago -
Stories about organizational ________ provide important clues
about cultural values and norms.
a. myths
b. heroes...
asked 42 minutes ago -
Explain the criteria used in selecting a target market
BUS220 Retail Management, thank you!
asked 44 minutes ago -
Convert/Calculate the following:
Determine the identity of an elemental gas if 4.55 L weighing
35.4g, under...
asked 47 minutes ago