
Homework Answers
| x | y | X^2 | y^2 | xy | |
| 86 | 78 | 7396 | 6084 | 6708 | |
| 84 | 68 | 7056 | 4624 | 5712 | |
| 90 | 57 | 8100 | 3249 | 5130 | |
| 74 | 75 | 5476 | 5625 | 5550 | |
| 85 | 80 | 7225 | 6400 | 6800 | |
| average | 83.8 | 71.6 | 7050.6 | 5196.4 | 5980 |
a. Scatter plot :
On X axis is Scores 1 and on Y axis is the scores of 2
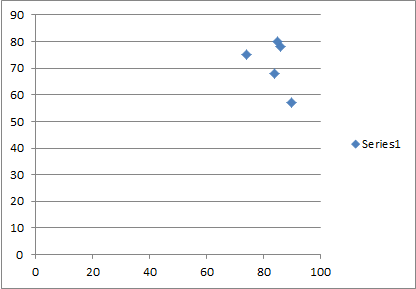
The plot clearly shows a negative association among the scores, i.e in a downward direction.
b Correlation coefficient is calculated using the formula
![r = \frac{average(xy) - average(x)*average(y)}{{\sqrt{[average(x^2)-(average(x))^{2})]*[average(y^2)-(average(y))^{2})]}}}](http://img.homeworklib.com/questions/57815140-fb8d-11ea-a01f-bb9956d3c97b.png?x-oss-process=image/resize,w_560) Substituting
the values, we get
Substituting
the values, we get
r = -0.453,
ie. as shown in the scatter plot the correlation coefficient also agrees with the negative relation.
c. Using the method of least squares, the estimated regression line is given by
Y=a+bX, where a is the intercept and b is the slope estimate.
![b = \frac{average(xy) - average(x)*average(y)}{{\sqrt{[average(x^2)-(average(x))^{2})]}}}](http://img.homeworklib.com/questions/57d65de0-fb8d-11ea-8502-1b77f4e2afbe.png?x-oss-process=image/resize,w_560)
and intercept =a = average(y) - b*average(x)
Substituting the values, we get , b= -0.713 and a=131.355
Thus, the regression line is Y= 131.355 -0.713X
When X=80, Y=131.355-0.713*80 = 74.315.
d. The value of r^2, ie the coefficient of determination shows the percentage of variation explained by the model.
here, r^2 = (-0.453)^2 = 0.205
i.e 0.205*100 = 20.5% of the total variation is only explained by the model.
e. Residual of a score is given by the difference between the given y and the estimated Y,,
When X=90, y =57
Estimated Y =131.355-0.713*90 = 67.185
Residual = 57-67.185 = -10.185
Add Answer to:
5. A group of 5 students scores on Exam 1 and Exam 2 in Math 1153...
A statistics instructor analyzed exam scores from their statistics class, where exam scores were scored between...
A statistics instructor analyzed exam scores from their statistics class, where exam scores were scored between 0 and 100. The regression line relating Final Exam scores to Midterm Exam scores is: final = 48.6 + 0.48 * midterm. question: Interpret the R-Squared value of 0.36 for this model: Answer options: A. 36% of the variability in final exam score is explained by midterm exam score. B. The correlation between final exam score and midterm exam score is 0.36. C. 64%...
2. The following data were collected last semester on ten students. Complete a multiple regression analysis in which you use AGE (A), MATH PROFICIENCY (MP) (on a 1 –10 scale), and GENDER (G) (0 = male...
2. The following data were collected last semester on ten students. Complete a multiple regression analysis in which you use AGE (A), MATH PROFICIENCY (MP) (on a 1 –10 scale), and GENDER (G) (0 = male, 1 = female) as predictors of FINAL EXAM (FE) performance. Do this analysis in SPSS and then answer the following questions. Subject # A MP G FE 1 35 8 1 90 2 31 6 0 88 3 26 5 1 84 4 33...
Consider the following scatterplot, regression equation, and correlation of midterm and final exam scores for a...
 Consider the following scatterplot, regression equation, and correlation of midterm and final exam scores for a class of 15 students. Which of the following are true statements? Select one answer ı points Y ะ 90.6-0.489x , r -0.602 110 100 90 80 , 5어 2 20 40 60 80 100 Mdterm Exam Score I. The same number of students scored 100 on the midterm exam as scored 100 on the final exam. II. Students who scored higher on the midterm...
The following data is exam score and hours looking at social media in that week of...
 The following data is exam score and hours looking at social media in that week of the exam from a sample of 10 students. Student 1 2 3 4 5 6 7 8 9 10 Exam Score 50 67 72 73 79 33 35 36 89 92 Hours 9.5 9.5 8.2 7.8 6.7 5.9 5.5 4.2 1.8 0.1 a) (3 points) Using the IQR rule are there any outliers for the exam scores? If so write down the number(s). Give...
At the Horton College of Engineering, Engineering students and Physics students took a math exam. Their...
 At the Horton College of Engineering, Engineering students and Physics students took a math exam. Their scores were used to make side-by-side boxplots. Answer the following questions: 1. Engineering o Physics 20 30 40 50 60 70 80 90 100 (1) What is the interquartile range among the physics students? (2) How low of a score on the exam would an engineering student need in order to be considered as an outlier? (3) Based on the boxplots, what is the...
1.) The scores for the final exam in Math 2250 is normally distributed with a mean...
 1.) The scores for the final exam in Math 2250 is normally distributed with a mean of 60 and standard deviation of 15. Given that 120 students wrote the final exam, i.) State and test the hypothesis that the mean score is greater than 65 at a 10% level of significance. Include a p-value in your answer. 141 ii.) Construct and interpret 90% confidence level for the mean score. [3] Using the same level of significance, determine how many students...
1. Complete a full regression analysis of the student data below: Student Math Placement Calculus Sketch...
 1. Complete a full regression analysis of the student data below: Student Math Placement Calculus Sketch the Scatterplot Test Grade sketch and interpret the residual plot 1 39 65 write the regression equation 2 43 78 interpret the regression coefficient 21 52 interpret the correlation coefficient and 64 82 coefficient of determination. 5 57 92 6 47 89 7 28 73 8 75 98 What is the predicted grade of a student who scores a "60" on the placement test?...
Number of Absences Number of Absences Exam Scores vs. Absences Exam Scores vs. Absences Final Exam...
 Number of Absences Number of Absences Exam Scores vs. Absences Exam Scores vs. Absences Final Exam Score Final Exam Score G 3 6 10 4 Number of Absences Number of Absences (e) Would it be reasonable to use the least-squares regression line to predict the final exam score for a student who has missed 15 class periods? Why or why not? O A. Yes, because the absolute value of the correlation coefficient is greater than the critical value for a...
the data below are the final exam scores of 10 randomly selected statistics students and the...
 the
data below are the final exam scores of 10 randomly selected
statistics students and the number of hours they studied for the
exam. What is the best predicted value for the exam score for a
student who stuided 2 hours? Assume that the varibles x and y have
a significant correlation.
Question 10 1 pts The data below are the final exam scores of 10 randomly selected statistics students and the number of hours they studied for the exam....
the
data below are the final exam scores of 10 randomly selected
statistics students and the number of hours they studied for the
exam. What is the best predicted value for the exam score for a
student who stuided 2 hours? Assume that the varibles x and y have
a significant correlation.
Question 10 1 pts The data below are the final exam scores of 10 randomly selected statistics students and the number of hours they studied for the exam....
Standardized test scores are often used as part of an application to college. Test scores in...
 Standardized test scores are often used as part of an application to college. Test scores in math and verbal we between 200 and 800 but have no units Complete parts a through below a) Verbal and math test scores of a high school graduating class are displayed in the waterpiot, with the regression line added to the phone come ever below O A. The association between math scores and verbal scores is moderately linear and positive. Students with high math...
 Consider the following scatterplot, regression equation, and correlation of midterm and final exam scores for a class of 15 students. Which of the following are true statements? Select one answer ı points Y ะ 90.6-0.489x , r -0.602 110 100 90 80 , 5어 2 20 40 60 80 100 Mdterm Exam Score I. The same number of students scored 100 on the midterm exam as scored 100 on the final exam. II. Students who scored higher on the midterm...
 The following data is exam score and hours looking at social media in that week of the exam from a sample of 10 students. Student 1 2 3 4 5 6 7 8 9 10 Exam Score 50 67 72 73 79 33 35 36 89 92 Hours 9.5 9.5 8.2 7.8 6.7 5.9 5.5 4.2 1.8 0.1 a) (3 points) Using the IQR rule are there any outliers for the exam scores? If so write down the number(s). Give...
 At the Horton College of Engineering, Engineering students and Physics students took a math exam. Their scores were used to make side-by-side boxplots. Answer the following questions: 1. Engineering o Physics 20 30 40 50 60 70 80 90 100 (1) What is the interquartile range among the physics students? (2) How low of a score on the exam would an engineering student need in order to be considered as an outlier? (3) Based on the boxplots, what is the...
 1.) The scores for the final exam in Math 2250 is normally distributed with a mean of 60 and standard deviation of 15. Given that 120 students wrote the final exam, i.) State and test the hypothesis that the mean score is greater than 65 at a 10% level of significance. Include a p-value in your answer. 141 ii.) Construct and interpret 90% confidence level for the mean score. [3] Using the same level of significance, determine how many students...
 1. Complete a full regression analysis of the student data below: Student Math Placement Calculus Sketch the Scatterplot Test Grade sketch and interpret the residual plot 1 39 65 write the regression equation 2 43 78 interpret the regression coefficient 21 52 interpret the correlation coefficient and 64 82 coefficient of determination. 5 57 92 6 47 89 7 28 73 8 75 98 What is the predicted grade of a student who scores a "60" on the placement test?...
 Number of Absences Number of Absences Exam Scores vs. Absences Exam Scores vs. Absences Final Exam Score Final Exam Score G 3 6 10 4 Number of Absences Number of Absences (e) Would it be reasonable to use the least-squares regression line to predict the final exam score for a student who has missed 15 class periods? Why or why not? O A. Yes, because the absolute value of the correlation coefficient is greater than the critical value for a...
 the
data below are the final exam scores of 10 randomly selected
statistics students and the number of hours they studied for the
exam. What is the best predicted value for the exam score for a
student who stuided 2 hours? Assume that the varibles x and y have
a significant correlation.
Question 10 1 pts The data below are the final exam scores of 10 randomly selected statistics students and the number of hours they studied for the exam....
the
data below are the final exam scores of 10 randomly selected
statistics students and the number of hours they studied for the
exam. What is the best predicted value for the exam score for a
student who stuided 2 hours? Assume that the varibles x and y have
a significant correlation.
Question 10 1 pts The data below are the final exam scores of 10 randomly selected statistics students and the number of hours they studied for the exam....
 Standardized test scores are often used as part of an application to college. Test scores in math and verbal we between 200 and 800 but have no units Complete parts a through below a) Verbal and math test scores of a high school graduating class are displayed in the waterpiot, with the regression line added to the phone come ever below O A. The association between math scores and verbal scores is moderately linear and positive. Students with high math...
Most questions answered within 3 hours.
-
The activation energy for a given reaction is 50.3 kJ/mol. If
the rate constant for the...
asked 8 minutes ago -
An entomologist discovers a dung beetle rolling a ball of dung
along the ground, and decides...
asked 1 hour ago -
Humans have used horses for transportation for millions of
years. Therefore, they will use horses for...
asked 3 hours ago -
The following are the Jensen Corporation's unit costs of making
and selling an item at a...
asked 4 hours ago -
Does direct Medicare reimbursement of Advanced practice nurses
increase access to their services?
asked 5 hours ago -
List and explain why a company would choose to use a
published
compensation survey vs. creating...
asked 5 hours ago -
A discrete random variable X can take values from 1 to 10. Find
the variance of...
asked 5 hours ago -
The primary financial goal of a corporation is to maximize:
shareholders wealth.
earnings per share.
stock...
asked 5 hours ago -
determine whether the vectors u=(1,2,3,), v=(-2,1,0) and
w=(1,0,1) are linearly dependent or independent.
asked 5 hours ago -
python
Define a function called print_values which takes a dictionary
object as a parameter. The function...
asked 6 hours ago -
In Chapter 1 you created a program named Triangle in
which you displayed a seven-line triangle...
asked 6 hours ago -
Research question: What are the differences between separately
stated and non separately stated transactions in an...
asked 7 hours ago