
Homework Answers
a). The differences are
| Observation |  |
| 1 | 42.3 - 45.5 = -3.2 |
| 2 | 47.2 - 46.4 = 0.8 |
| 3 | 43.6 - 45.7 = -2.1 |
| 4 | 46.4 - 50.5 = -4.1 |
| 5 | 47.9 - 50.4 = -2.5 |
| 6 | 45.6 - 45.7 = -0.1 |
| 7 | 48.2 - 49.4 = -1.2 |
| 8 | 49.6 - 49.7 = -0.1 |
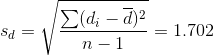
b) 
c) In order to test this, the correct null and alternate hypothesis are


option C is correct.
The value of the test statistics is
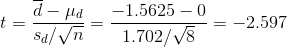
The p-value corresponding to a test statistics of -2.597 and degree of freedom of 7 is 0.018.
Since the p-value is less than the significance level, hence we will reject the null hypothesis.
Result - We will reject the null hypothesis. There is sufficient
evidence that  at the
  level of significance.
Option D is correct.
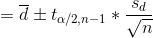
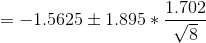
d) The 95% confidence interval around the population mean difference is

Thank You!! Please Upvote!!
Add Answer to:
Assume that the differences are normally distributed. Complete parts (a) through (d) below. 1 4 5...
Assume that the differences are normally distributed. Complete parts (a) through (d) below. 1 4 5...
 Assume that the differences are normally distributed. Complete parts (a) through (d) below. 1 4 5 7 8 Observation X 2 49.1 3 44.6 6 50.8 46.0 49.8 48.8 46.7 50.0 Y 49.4 47.6 46.8 54.6 50.4 50.4 46.8 52.7 (a) Determine d =X-Y for each pair of data. 1 3 4 5 6 7 8 Observation 2 d; (Type integers or decimals.) (b) Computed and sd- (Round to three decimal places as needed.) Sda (Round to three decimal places...
Assume that the differences are normally distributed. Complete parts (a) through (d) below. 9 Observation X;...
 Assume that the differences are normally distributed. Complete parts (a) through (d) below. 9 Observation X; 1 46.2 47.8 2 54.6 54.3 3 46.0 51.1 4 45.7 50.8 5 42.6 45.2 6 50.4 50.1 7 45.4 49.2 8 45.0 47.6 (a) Determine d; = x; -Y; for each pair of data. Observation 1 2 0 0 (Type integers or decimals.) 3 0 4 0 5 0 6 0 7 0 8 0 (b) Computed and sd. und to three decimal...
11. Assume that the differences are normally distributed. Complete parts (a) through (d) below. Observation 1...
 11. Assume that the differences are normally distributed. Complete parts (a) through (d) below. Observation 1 2 3 4 5 6 7 8 X 50.1 49.4 50.2 44.1 51.4 51.8 50.6 46.9 Y 53.5 49.3 53.3 48.2 51,2 51.7 54.4 48.5 (a) Determine d = X - Y, for each pair of data. 2 3 4 5 6 7 Observation 1 di (Type integers or decimals.) (b) Computed and sa da (Round to three decimal places as needed.) Sg =...
11. Assume that the differences are normally distributed. Complete parts (a) through (d) below. Observation X...
 11. Assume that the differences are normally distributed. Complete parts (a) through (d) below. Observation X Y 1 52.6 53.3 2 52.5 3 44.4 4 44.0 48.4 5 55.1 6 464 7 478 50.5 B 50.4 52.6 51.8 49.5 54.3 49.2 (a) Determine d = XY, for each pair of data. 2 5 6 7 Observation d (Type integers or decimals.) (b) Computed and s. (Round to three decimal places as needed.) Sa (Round to three decimal places as needed.)...
7. Assume that the differences are normally distributed. Complete parts (a) through (d) belovw Ob...
 7. Assume that the differences are normally distributed. Complete parts (a) through (d) belovw Observation 1 53.4 49.4 51.7 48.1 49.1 50.6 43.954.0 54.6 48.9 54.4 53.8 49.7 51.3 46.5 53.1 (a) Determine di =Xi-Yi for each pair of data Observation 4 (Type integers or decimals.) (b) Compute d and sd (Round to three decimal places as needed.) (Round to three decimal places as needed.) (c) Test itụd < 0 at the α-0.05 level of significance What are the correct...
Assume that the differences are normally distributed. Complete parts (a) through (d) below Observation 1 2...
 Assume that the differences are normally distributed. Complete parts (a) through (d) below Observation 1 2 3 45 678 44.1 52.2 44.5 483 433 516 522438 45.2 537 48.7 534 45.1 548 533459 (a) Determine d X-Y for each pair of data Observation 34567 (Type integers or decimals.) (b) Compute d and sa d(Round to three decimal places as needed) sa Round to three decimal places as needed.) (c) Test if Ha 0 at the a 0.05 level of significance...
1.2. Assume that the differences are normally distributed. Complete parts (a) through (d) below. 1 3...
 1.2.
Assume that the differences are normally distributed. Complete parts (a) through (d) below. 1 3 4 6 8 Observation X 2 53.4 5 49.0 7 46.1 43.3 46.2 42.4 51.4 51.7 46.9 52.9 48.8 47.3 51.9 54.8 46.7 52.6 - 2.6 - 4.9 - 2.9 -3.4 -0.6 -.9 d; -3.6 .5 (Type integers or decimals.) (b) Computed and sd d = -2.300 (Round to three decimal places as needed.) Sa = 1.805 (Round to three decimal places as needed.)...
1.2.
Assume that the differences are normally distributed. Complete parts (a) through (d) below. 1 3 4 6 8 Observation X 2 53.4 5 49.0 7 46.1 43.3 46.2 42.4 51.4 51.7 46.9 52.9 48.8 47.3 51.9 54.8 46.7 52.6 - 2.6 - 4.9 - 2.9 -3.4 -0.6 -.9 d; -3.6 .5 (Type integers or decimals.) (b) Computed and sd d = -2.300 (Round to three decimal places as needed.) Sa = 1.805 (Round to three decimal places as needed.)...
19 25 The sample of six measurements shown below was randomly selected from a normally distributed...
 19 25 The sample of six measurements shown below was randomly selected from a normally distributed population. Complete parts a through c. 1,2,3,3,4,1 a. Test the null hypothesis that the mean of the population is 3 against the alternative hypothesis. p < 3. Use a = 0.05 Ifq=0.05, find the rejection region for the test. Choose the correct answer below. % 1994 1994 OA. <-2015 or t> 2015 Oct-2571 O E. > 2571 OB < -2015 OD < -2571 ort...
14. Use the following information to complete steps (a) through (d) below. A random sample of...
 14. Use the following information to complete steps (a) through (d) below. A random sample of n = 135 individuals results in x1 = 40 successes. An independent sample of n2 = 140 individuals results in X2 = 60 successes. Does this represent sufficient evidence to conclude that p1 <P2 at the a=0.05 level of significance? (a) What type of test should be used? O A. A hypothesis test regarding the difference between two population proportions from independent samples. OB....
Use the following information to complete steps (a) through (d) below. A random sample of ny...
 Use the following information to complete steps (a) through (d) below. A random sample of ny = 135 individuals results in xy = 40 successes. An independent sample of n2 = 150 individuals results in x2 = 60 successes. Does this represent sufficient evidence to conclude that P, <P2 at the a = 0.10 level of significance? (a) What type of test should be used? A. A hypothesis test regarding the difference between two population proportions from independent samples. B....
 Assume that the differences are normally distributed. Complete parts (a) through (d) below. 1 4 5 7 8 Observation X 2 49.1 3 44.6 6 50.8 46.0 49.8 48.8 46.7 50.0 Y 49.4 47.6 46.8 54.6 50.4 50.4 46.8 52.7 (a) Determine d =X-Y for each pair of data. 1 3 4 5 6 7 8 Observation 2 d; (Type integers or decimals.) (b) Computed and sd- (Round to three decimal places as needed.) Sda (Round to three decimal places...
 Assume that the differences are normally distributed. Complete parts (a) through (d) below. 9 Observation X; 1 46.2 47.8 2 54.6 54.3 3 46.0 51.1 4 45.7 50.8 5 42.6 45.2 6 50.4 50.1 7 45.4 49.2 8 45.0 47.6 (a) Determine d; = x; -Y; for each pair of data. Observation 1 2 0 0 (Type integers or decimals.) 3 0 4 0 5 0 6 0 7 0 8 0 (b) Computed and sd. und to three decimal...
 11. Assume that the differences are normally distributed. Complete parts (a) through (d) below. Observation 1 2 3 4 5 6 7 8 X 50.1 49.4 50.2 44.1 51.4 51.8 50.6 46.9 Y 53.5 49.3 53.3 48.2 51,2 51.7 54.4 48.5 (a) Determine d = X - Y, for each pair of data. 2 3 4 5 6 7 Observation 1 di (Type integers or decimals.) (b) Computed and sa da (Round to three decimal places as needed.) Sg =...
 11. Assume that the differences are normally distributed. Complete parts (a) through (d) below. Observation X Y 1 52.6 53.3 2 52.5 3 44.4 4 44.0 48.4 5 55.1 6 464 7 478 50.5 B 50.4 52.6 51.8 49.5 54.3 49.2 (a) Determine d = XY, for each pair of data. 2 5 6 7 Observation d (Type integers or decimals.) (b) Computed and s. (Round to three decimal places as needed.) Sa (Round to three decimal places as needed.)...
 7. Assume that the differences are normally distributed. Complete parts (a) through (d) belovw Observation 1 53.4 49.4 51.7 48.1 49.1 50.6 43.954.0 54.6 48.9 54.4 53.8 49.7 51.3 46.5 53.1 (a) Determine di =Xi-Yi for each pair of data Observation 4 (Type integers or decimals.) (b) Compute d and sd (Round to three decimal places as needed.) (Round to three decimal places as needed.) (c) Test itụd < 0 at the α-0.05 level of significance What are the correct...
 Assume that the differences are normally distributed. Complete parts (a) through (d) below Observation 1 2 3 45 678 44.1 52.2 44.5 483 433 516 522438 45.2 537 48.7 534 45.1 548 533459 (a) Determine d X-Y for each pair of data Observation 34567 (Type integers or decimals.) (b) Compute d and sa d(Round to three decimal places as needed) sa Round to three decimal places as needed.) (c) Test if Ha 0 at the a 0.05 level of significance...
 1.2.
Assume that the differences are normally distributed. Complete parts (a) through (d) below. 1 3 4 6 8 Observation X 2 53.4 5 49.0 7 46.1 43.3 46.2 42.4 51.4 51.7 46.9 52.9 48.8 47.3 51.9 54.8 46.7 52.6 - 2.6 - 4.9 - 2.9 -3.4 -0.6 -.9 d; -3.6 .5 (Type integers or decimals.) (b) Computed and sd d = -2.300 (Round to three decimal places as needed.) Sa = 1.805 (Round to three decimal places as needed.)...
1.2.
Assume that the differences are normally distributed. Complete parts (a) through (d) below. 1 3 4 6 8 Observation X 2 53.4 5 49.0 7 46.1 43.3 46.2 42.4 51.4 51.7 46.9 52.9 48.8 47.3 51.9 54.8 46.7 52.6 - 2.6 - 4.9 - 2.9 -3.4 -0.6 -.9 d; -3.6 .5 (Type integers or decimals.) (b) Computed and sd d = -2.300 (Round to three decimal places as needed.) Sa = 1.805 (Round to three decimal places as needed.)...
 19 25 The sample of six measurements shown below was randomly selected from a normally distributed population. Complete parts a through c. 1,2,3,3,4,1 a. Test the null hypothesis that the mean of the population is 3 against the alternative hypothesis. p < 3. Use a = 0.05 Ifq=0.05, find the rejection region for the test. Choose the correct answer below. % 1994 1994 OA. <-2015 or t> 2015 Oct-2571 O E. > 2571 OB < -2015 OD < -2571 ort...
 14. Use the following information to complete steps (a) through (d) below. A random sample of n = 135 individuals results in x1 = 40 successes. An independent sample of n2 = 140 individuals results in X2 = 60 successes. Does this represent sufficient evidence to conclude that p1 <P2 at the a=0.05 level of significance? (a) What type of test should be used? O A. A hypothesis test regarding the difference between two population proportions from independent samples. OB....
 Use the following information to complete steps (a) through (d) below. A random sample of ny = 135 individuals results in xy = 40 successes. An independent sample of n2 = 150 individuals results in x2 = 60 successes. Does this represent sufficient evidence to conclude that P, <P2 at the a = 0.10 level of significance? (a) What type of test should be used? A. A hypothesis test regarding the difference between two population proportions from independent samples. B....
Most questions answered within 3 hours.
-
How many grams of C6H12O6 are needed to prepare 350 mL of 2.5 M
C6H1206 solution?
asked 35 seconds from now -
At Litchfield College of Nursing, 88% of incoming freshmen
nursing students are female and 12% are...
asked 3 minutes ago -
Inductance refers to the tendency for an electrical
element to resist
A) current flow
...
asked 1 minute ago -
What influences our own opinions about racism/sexism
more? Family or Friends?
asked 3 minutes ago -
Question #3 (this involves the idea of labor
and capital) PLEASE TYPE OUT THE ANSWER
A...
asked 6 minutes ago -
1. Write
the chemical equation for the synthesis of aspirin (ASA) from
salicylic acid (SA) and acetic...
asked 29 minutes ago -
True or False? If ammonia synthesis occurs at 723 K and 100 atm,
its equilibrium constant...
asked 27 minutes ago -
The reaction of iron and water vapor results in an equilibrium 3
Fe(s) + 4 H2O...
asked 28 minutes ago -
Bill Alther is a zoologist who studies Anna's hummingbird
(Calypte anna).† Suppose that in a remote...
asked 30 minutes ago -
It is important that face masks used by firefighters be able to
withstand high temperatures because...
asked 49 minutes ago -
explain with the experiment showing one gene one
enzyme hypothesis by tantum and beadle?
asked 48 minutes ago -
test the null hypothesis H0
H0 : In college, the average GPA of men is equal...
asked 1 hour ago